Your team is probably still using at least one timeline slide that looks fine in review and falls flat in the meeting. It lists phases, dates, and maybe a few icons. Then the buyer asks the core question: what happens if procurement slips, if implementation needs more customer effort than expected, or if the roadmap item they care about lands later than planned? The slide can’t answer, so the presenter starts talking around it.
That’s where most timeline slides fail. They’re built as decoration, not as operating tools. A static row of Q1, Q2, and Q3 doesn’t help an AE defend a close plan. It doesn’t help a sales engineer show technical sequencing. It doesn’t help a CSM align stakeholders on onboarding. It just fills space.
The stronger approach is to treat timelines as working narratives tied to real systems. When timelines pull from CRM fields, Google Sheets, product usage data, or implementation plans, they stop being passive visuals and start doing sales work. They show momentum, expose risk, clarify ownership, and make next steps easier to agree on.
That shift matters because teams are investing more heavily in timeline-based communication. The Project Timeline Wall Chart market is projected to reach $1.35 billion in 2026 and grow at a 6.2% CAGR through 2034, according to Data Insights Market reporting on project timeline wall charts. In practice, that shows up in revenue teams using more visual project tracking, not fewer.
These creative timelines ideas focus on actionable results. Each one is built for sales decks in 2026, with practical workflows for Encelade, CRM data sources, and presales execution.
1. Deal Progression Timeline with Live Win Probability
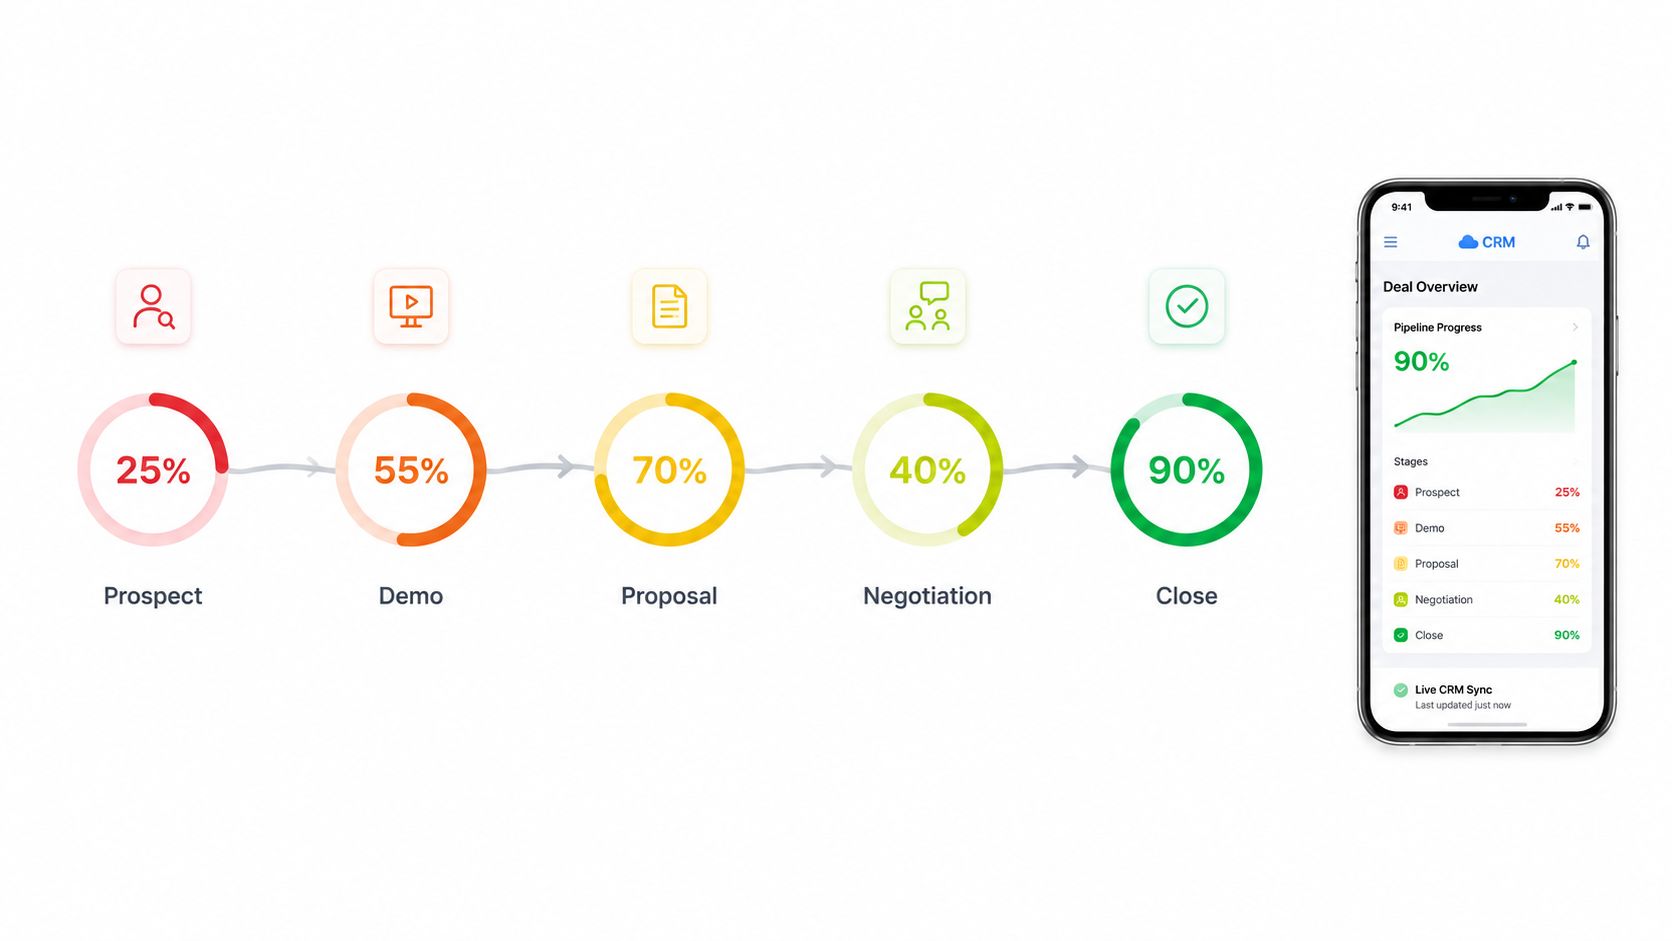
A forecast call goes sideways fast when the CRM says “Proposal” but the blocker is security review, procurement has not engaged, and the executive sponsor has gone quiet. A deal progression timeline fixes that gap because it shows how the opportunity is advancing across parallel workstreams, not just which stage field changed last.
For revenue teams, this timeline works best as an operating view, not a design exercise. Build it in Encelade as a live Gantt tied to Salesforce or HubSpot fields for stage, owner, next step, target close date, and win probability. Then layer in the signals that sales leaders and presales teams use to judge deal health: mutual action plan progress, stakeholder coverage, security status, commercial redlines, and decision date confidence.
Make pipeline movement visible
Use separate tracks for commercial, technical, procurement, and stakeholder alignment. That structure helps an AE explain slippage without sounding evasive, and it helps an SE show where technical validation is complete versus where customer action is still pending.
Three setup choices usually determine whether this becomes useful or noisy:
- Sync the right fields, not every field: Pull only the CRM data that changes decisions, such as current stage, probability, open risks, next meeting date, and required customer actions.
- Show probability changes over time: A live win probability line is more credible when buyers and internal teams can see why confidence rose or fell after a demo, legal review, or executive meeting.
- Preserve the final version: Export the closed-won timeline to PDF or snapshot it in the account record so customer success inherits the pre-sales path, commitments, and dependencies.
I have seen this work especially well in account reviews where sales and presales usually bring different versions of the truth. One live timeline cuts down on status debate and redirects the conversation to action. Which stakeholder is unconfirmed? Which approval path is at risk? What has to happen this week to protect the close date?
Practical rule: If a timeline cannot answer “what is blocking this deal right now,” it is decoration, not enablement.
The creative part is not the styling. It is the way the timeline groups work by risk and decision path so the team can act on it. A useful version shows more than dates. It connects CRM data, probability updates, and owner-level accountability in one view the AE, SE, manager, and buyer can all use. If your team still builds that manually, switch to a workflow designed for interactive presentation creation in Encelade.
2. Customer Success Milestone Timeline for Onboarding
The best onboarding timeline gets sold before the contract is signed. Buyers want confidence that your team knows what happens after kickoff, who owns each workstream, and where customer effort is required. If they can’t see that, they’ll assume the implementation will be heavier than you’re admitting.
A customer success milestone timeline should break onboarding into visible commitments: kickoff, environment setup, integrations, admin training, pilot, go-live, and adoption review. HubSpot implementations and Workday deployment discussions often get stronger when sales and customer success present that roadmap together instead of waiting until after signature.
Turn onboarding into a shared plan
Encelade’s Gantt widget is useful here because it can connect directly to Google Sheets. That matters for teams that already track implementation readiness, training dates, and task ownership in shared spreadsheets. Once the deck pulls those cells live, the onboarding slide stops becoming a stale pre-sales promise.
Use a structure like this:
- Assign visible owners: Tag each milestone to your team, the customer, or a partner so responsibility is explicit.
- Embed proof at key moments: Add short feature walkthrough videos at milestones where buyer confidence usually dips.
- Co-brand the deck: Apply the customer’s colors through bulk restyling so the plan feels like a joint working document, not vendor collateral.
What doesn’t work is over-detailing every task in the first sales conversation. Buyers don’t need twenty tiny sub-steps on one slide. They need confidence that the path is real, that dependencies are understood, and that completion status can stay current after close.
For implementation partners, share the live link before the deal closes. Then customer success can update status in real time after signature without rebuilding the deck. That continuity is what makes onboarding timelines effective. They aren’t just persuasive in the sales cycle. They remain useful once execution starts.
3. Competitive Displacement Timeline
A late-stage deal stalls. The buyer agrees their current system is dated, but the incumbent still feels safer because it is familiar. A competitive displacement timeline helps the account team change that discussion from opinion to sequence. It shows what changed in the category, how the incumbent responded, and where your product created measurable advantages for similar accounts.
This works best in replacement deals, not greenfield evaluations. Revenue teams use it to explain timing, migration risk, and the business case for change in one view. The slide should help an AE, SE, and sales manager tell the same story with account-specific proof pulled from CRM notes, loss reasons, product release history, and customer references.
Show why the switch makes sense now
Build the timeline on three tracks. The first shows category shifts such as new security requirements, buying process changes, or workflow expectations. The second shows competitor milestones, including pricing changes, packaging moves, acquisitions, support policy changes, or delayed product updates. The third shows your product evidence, such as feature releases, implementation outcomes, and customer wins in the same segment.
In Encelade, connect those inputs to live sources instead of rebuilding the slide every quarter. Pull incumbent mentions and objection themes from your CRM. Sync release dates from product systems through an API or a managed sheet. Add account-specific proof points so the timeline changes by industry, region, or competitor without creating ten separate deck versions.
A good displacement timeline is disciplined. It does not turn into a feature comparison slide stretched across a few dates.
Use these guardrails:
- Anchor every milestone to buyer risk or buyer value: Show what changed in compliance, cost, adoption, speed, or admin effort.
- Use competitor facts, not opinion: Pricing updates, end-of-support notices, integration gaps, and public roadmap misses are stronger than broad claims.
- Map each point to a sales motion: Give reps a talk track for discovery, technical validation, and executive review.
- Review the timeline with product marketing and presales each quarter: Competitive stories decay quickly when one team updates and the others do not.
- Track buyer engagement on the slide: Encelade analytics can show whether champions spend time on migration proof, roadmap evidence, or customer examples.
The trade-off is clarity versus completeness. If the slide tries to cover every release and every rival, buyers stop reading. Keep the timeline narrow. One competitor, one migration path, one clear reason the account should change now.
Skip weak supporting stats that do not directly advance the case. A generic marketing usage number does not help a sales team displace an incumbent. What does help is evidence from your own funnel, such as repeated loss reasons, longer implementation times with the old approach, or stronger win rates when a specific capability became available in your product.
Build a timeline that explains the buyer’s decision path, not a timeline that attacks the competitor.
Export a PDF version for rep training and approval control. Keep the live version in Encelade for deal-specific customization, so sales and presales can update proof without breaking the core message.
4. Product Roadmap Timeline with Feature Release Cadence
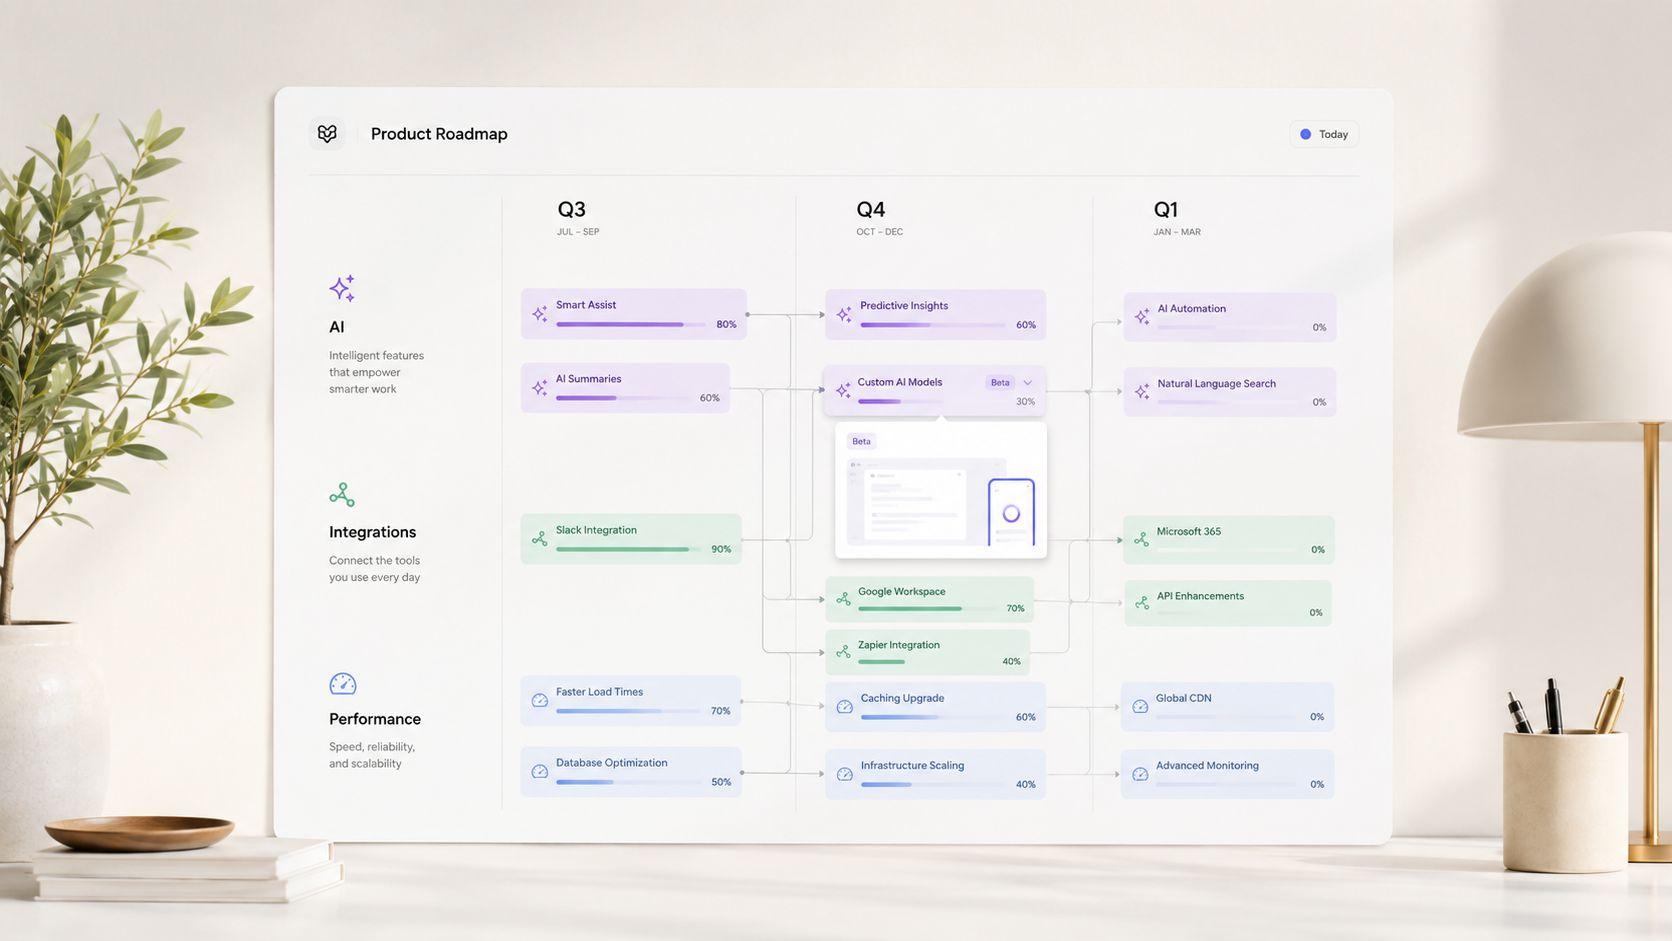
A roadmap timeline can build trust fast, or destroy it just as fast. The difference is whether the slide helps the buyer understand direction without turning your sales team into an accidental source of product commitments.
The cleanest roadmap timelines show release cadence across broad windows, usually six to twenty-four months, with clear separation between shipped capabilities, in-progress priorities, and directional areas. That gives product, sales, and legal fewer problems later.
Sell direction without overpromising
The technical side should be live. If your product team manages roadmap data in Jira or Asana, connect that source to Encelade through an API or a synced intermediate sheet. Then lock a sales-safe version each quarter so reps aren’t improvising from outdated screenshots.
Use these guardrails:
- Stay date-light in public-facing decks: Label windows by half or quarter, not by exact day.
- Tie features to buyer pain: A roadmap item matters only if the account can see why it changes their business case.
- Separate committed from directional work: Blending those is what creates confusion in late-stage deals.
Venngage’s timeline examples guide points to practical design choices that matter here, including using icons to represent different event types, color blocks to separate task categories, and clear milestone and owner labeling, as described in Venngage’s timeline examples guide. Those aren’t just design flourishes. They help revenue teams explain complicated product sequencing without extra narration.
The mistake I see most often is stuffing the roadmap with every planned enhancement. That doesn’t reassure buyers. It overwhelms them. Pick the roadmap moments that support the account’s use case, then add a final forward-looking node that signals momentum without creating contractual risk.
5. Sales Cycle Velocity Benchmark Timeline
A rep walks into forecast call saying the deal is healthy because the champion is engaged and the demo landed well. RevOps sees something else. Similar deals in the same segment usually clear security review by week six, but this one is entering week nine with no infosec owner assigned. A sales cycle velocity benchmark timeline puts that gap on one slide, which makes the discussion sharper fast.
This timeline compares the current opportunity against historical pacing for similar deals. Used well, it helps managers coach earlier, helps reps set firmer mutual action plans, and helps buyers understand what has to happen by when if they want a realistic close date.
Benchmark against your real motion
Build separate benchmarks by segment and motion. Enterprise expansion deals do not move like net-new mid-market deals. A procurement-heavy buying process does not move like a technical evaluation led by one architect. If you blend those paths into one average timeline, the slide becomes decorative instead of useful.
In practice, the strongest version pulls stage-entry and stage-exit dates from your CRM, then groups opportunities by a few variables your team sells through:
- Segment benchmark: SMB, mid-market, enterprise, or strategic accounts
- Motion benchmark: New logo, renewal, expansion, competitive replacement
- Risk checkpoint timing: Security review, legal review, business case approval, procurement
- Current deal variance: Days ahead or behind benchmark at each milestone
Encelade is useful here because it can turn CRM exports, warehouse tables, or a synced Google Sheet into a client-ready timeline instead of another ops report. I usually recommend a weekly refresh. Daily updates sound attractive, but for many revenue teams they create noise unless stage hygiene is already tight.
The trade-off is accuracy versus maintainability. A highly detailed model with ten filters feels precise, but reps stop trusting it if field values are messy or ownership is inconsistent. Start with two or three benchmark cohorts your managers already use in pipeline review. Then add complexity only after the team proves the data is clean enough to support it.
This also gives presales a practical asset. Solution consultants can use the benchmark timeline during late-stage evaluation to show where technical validation, stakeholder review, and commercial approvals typically slow down. That shifts the conversation from vague urgency to concrete coordination.
For buyer-facing decks, avoid raw CRM screenshots. Build the slide as a decision narrative: what usually happens, where this deal sits now, what must happen next, and which owner is responsible on each side. If your team needs a cleaner way to structure that story, use this framework for presentation storytelling in business decks.
Static timelines age quickly, especially once legal, procurement, and security enter the deal and dates start moving. That’s why more revenue teams lean on live progress tracking: a benchmark that updates itself stays credible, while a hand-built one is stale within a week.
6. Customer Journey Map Timeline
A rep walks into a late-stage meeting thinking the deal is in procurement. The buyer sees it differently. Security still has questions, the champion has not aligned finance, and an executive sponsor has only skimmed the proposal. A customer journey map timeline fixes that gap because it shows how the decision forms over time, by stakeholder, proof point, and point of friction.
For revenue teams, this is not a brand exercise. It is a working model for account strategy. The strongest version ties buyer activity to CRM history, call notes, mutual action plans, and presales milestones so the team can see where momentum is real and where it is assumed.
Map buying motion at the stakeholder level
Start with a sample of recent wins, losses, and stalled deals. Look for repeated moments such as problem recognition, champion formation, technical validation, commercial review, legal review, and internal approval. Then map those moments on a timeline with the people involved, the questions they raised, and the proof they needed to move forward.
That structure gives sales and presales something they can use in live deal reviews.
In Encelade, teams usually build this as a reusable narrative layer on top of account data. A solution consultant can update one stakeholder node after a demo, sales can pull CRM fields into the same timeline, and customer success can inherit the record after signature instead of rebuilding the story from scratch. The trade-off is upkeep. If the team adds too many fields or custom stages, reps stop maintaining it and the slide becomes decoration.
Keep the model simple enough to survive weekly use. Focus on the events that change deal direction, not every touchpoint.
A practical customer journey map timeline should show:
- Stakeholder entry points: When the champion, evaluator, approver, and blocker became active.
- Decision triggers: What caused the account to move, pause, or expand scope.
- Proof moments: Demo, pilot, business case review, reference call, security sign-off.
- Friction points: Budget concerns, integration risk, unclear ownership, competing priorities.
- Next required action: What must happen next, who owns it, and what evidence is still missing.
The timeline becomes more than a visual. It becomes a coaching tool. Managers can inspect whether a deal has real multithreading, presales can spot where technical confidence dropped, and account teams can adjust the narrative before the next customer meeting.
For buyer-facing use, replace generic labels with the customer’s actual roles and decisions. “Technical validation” is vague. “Architecture review with IT director and security lead” is specific, credible, and easier to advance. That level of detail also makes handoffs cleaner after the sale because the post-sale team can see which commitments were made, which risks were surfaced, and which stakeholder relationships still need work.
A generic awareness-to-decision diagram rarely helps a deal move. An account-based journey timeline can.
7. Implementation Timeline with Resource Allocation
A credible implementation timeline does one thing better than almost any other sales slide. It proves your team has already thought through the work. That matters late in the cycle, especially when procurement is close and the buyer starts asking who will need to do what on their side.
Salesforce and Workday teams often use this kind of timeline during contract negotiation because it lowers perceived delivery risk. A buyer who can see phase owners, dependencies, and customer responsibilities is less likely to assume the project will become a black box after signature.
Prove your team has an execution plan
Build the slide with professional services input from the start. If sales writes it alone, the timeline usually becomes too optimistic. In Encelade, shared workspaces make this easier because presales, services, and customer success can all edit the same underlying narrative instead of trading versions over email.
Use a phased layout with tracks for your team, the customer, and any external partner. Then add contingency notes where delays commonly happen, such as data migration, security review, or stakeholder training.
A strong resource allocation timeline should show:
- Named responsibility bands: Internal team, customer team, partner team.
- Dependencies: What must finish before the next workstream begins.
- Risk flags: Areas that often slip and what you’ll do if they do.
This kind of timeline also works well as a live object after close. Share the link with stakeholders so they can monitor progress without asking for a new deck every week.
For a practical example of timeline-led communication in a video format, this walkthrough is worth reviewing:
The more precise you are about customer effort, the more believable your implementation plan becomes.
8. Market Trend Timeline Showing Industry Shifts
Some deals stall because the buyer understands your product but doesn’t yet feel category urgency. A market trend timeline solves that by teaching the external context around the purchase. It places your solution inside broader shifts in technology, regulation, or operating models.
This is especially useful in cybersecurity, data infrastructure, AI governance, and compliance-heavy categories. A zero-trust story, for example, lands better when the buyer sees how security expectations evolved over time rather than hearing a list of current features.
Teach the category while you sell
Build the timeline around a sequence of external triggers. Regulatory changes, infrastructure shifts, and operating model changes should come first. Your product should appear later in the timeline as the response, not the headline.
A few practices help:
- Use primary institutional anchors: Regulatory bodies and formal market documents carry more weight than vague commentary.
- Tailor the angle by persona: A CTO wants architecture implications. A CFO wants risk and cost implications.
- Refresh quarterly: Trend timelines get stale faster than teams expect.
This format also benefits from strong data visualization. Encelade’s widget library gives teams room to combine timelines with charts, embedded visuals, and browser-native interactive elements. If you’re designing one of these for executive buyers, apply data visualization best practices for business presentations so the trend line supports the story instead of competing with it.
What doesn’t work is stuffing the slide with every headline from the past year. Pick the shifts that directly affect budget, operating risk, or strategic timing. Then show why waiting creates more friction than acting now.
9. Customer Reference Timeline Showing Customer Success Stories
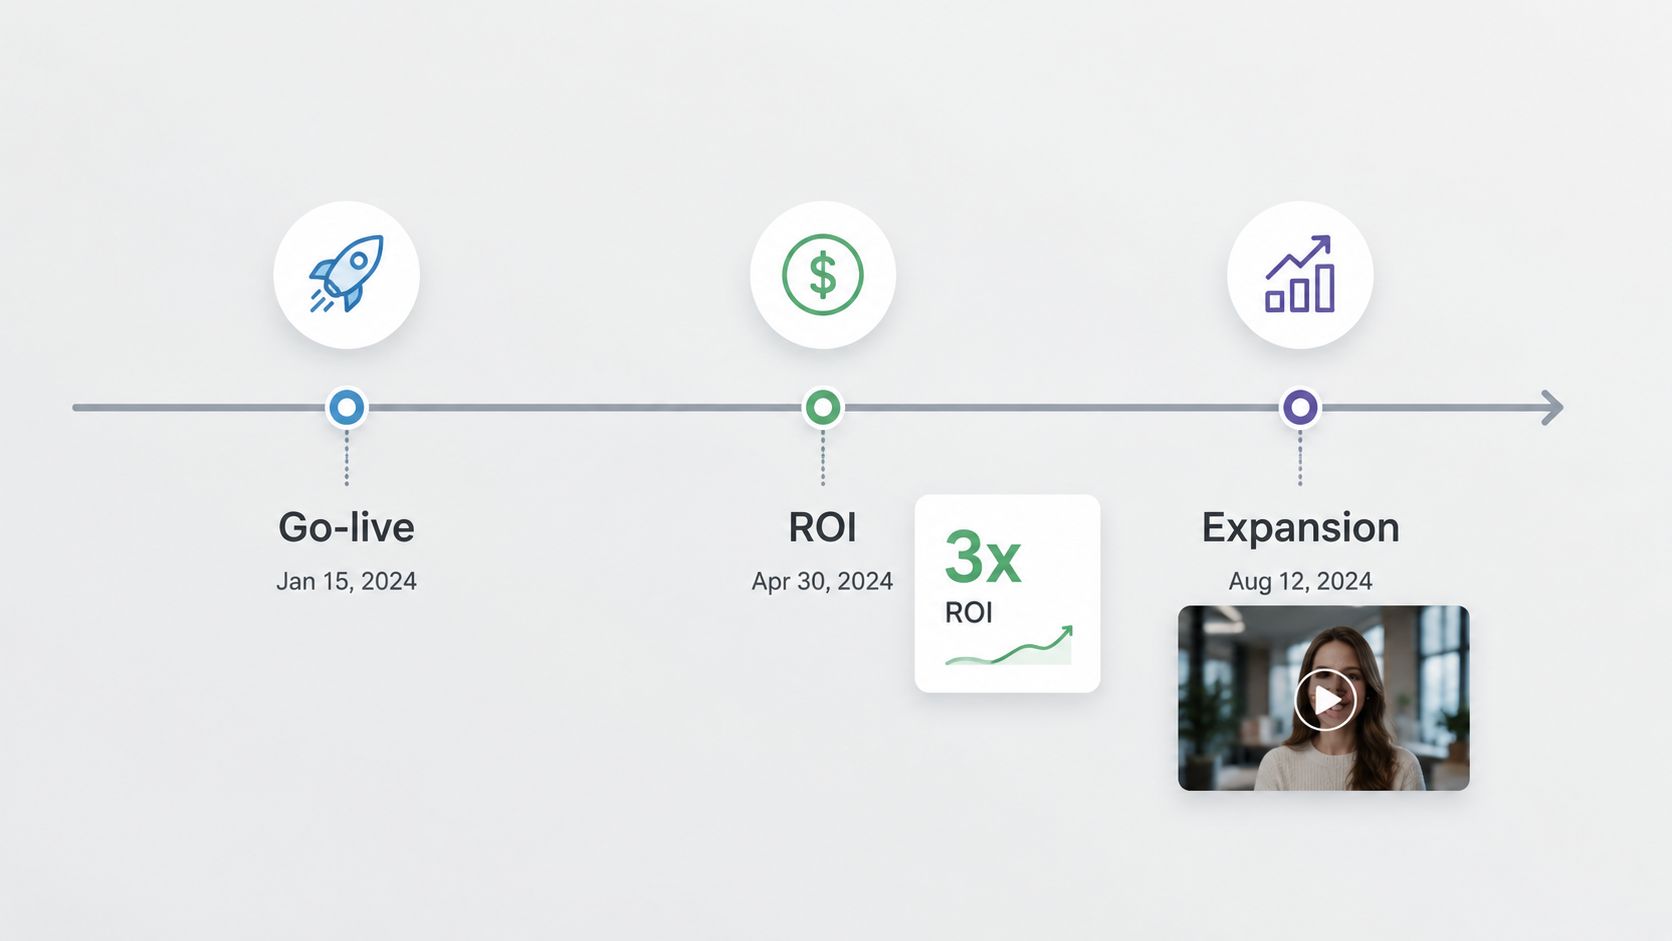
A rep is in a late-stage deal. Procurement is asking for proof, the economic buyer wants a low-risk decision, and the champion needs a story they can retell internally. A logo slide rarely gets the job done. A customer reference timeline works better because it shows the sequence buyers care about: why the customer bought, how fast they reached a useful outcome, and what expanded after the first win.
This format is especially effective for revenue teams because it turns customer proof into something operational. Instead of storing references as static PDFs or one-off case studies, build a timeline from fields your team already tracks in CRM, customer success platforms, and a shared reference database. In Encelade, teams can pull those milestones into a reusable slide, then filter by industry, segment, use case, or deployment model during live deal reviews.
Show the path from decision to expansion
The strongest reference timelines are built around business events, not marketing copy. Start with the purchase trigger. Then map onboarding completion, first measurable result, wider team adoption, renewal, and expansion. That structure gives sales and presales a way to answer the actual buyer question: “What happened after signature?”
A practical setup looks like this:
- Define milestone fields in the source data: Track dates for closed-won, go-live, first value event, renewal, and expansion in Salesforce, HubSpot, or your customer success system.
- Tag each story for retrieval: Add filters for industry, company size, persona, product line, and primary outcome so reps can pull the closest match fast.
- Show proof at two speeds: Include one early operational win and one later strategic outcome. Buyers want both time-to-value and durability.
- Name the customer stakeholders: Add the champion, admin, or executive sponsor when permission allows. That gives the story organizational context, not just company branding.
- Keep the timeline live: Use Sheets or API-fed datasets so new customer milestones appear without rebuilding the slide every quarter.
There is a trade-off here. The more specific the story, the more persuasive it becomes. It also becomes harder to reuse across segments. I usually recommend keeping one highly targeted timeline for late-stage enterprise deals and a broader version for earlier discovery calls.
The slide also needs discipline. Do not cram five customer stories onto one timeline. One clear example usually beats a collage of partial proof. If the deal requires multiple references, stack two short timelines by use case or buying motion so the audience can compare them quickly.
A strong customer reference timeline does one job well. It helps the buyer picture adoption after purchase, using evidence your team can verify and update from the systems you already run.
10. Quarterly Business Review QBR Timeline Dashboard
The meeting starts in ten minutes. The customer has already asked for adoption trends, open support risks, progress against the success plan, and a clear recommendation for next quarter. If those answers live across six slides and three systems, the QBR turns into a recap exercise instead of an account planning session.
A QBR timeline dashboard fixes that by putting the quarter into one operating view. Revenue teams can line up agreed priorities, delivered milestones, product usage shifts, support events, executive asks, and expansion signals on a single timeline. That matters because the customer is not buying a deck. They are judging whether your team understands their business well enough to guide the next decision.
For sales, presales, and customer success teams, this format works best when it is tied to live systems, not copied into slides the night before. Encelade can pull timeline blocks from CRM fields, product analytics feeds, support platforms, and Sheets so account teams present current account history instead of stale screenshots. The business impact is straightforward. Reps spend less time rebuilding reviews, managers get more consistent account readouts, and customers get a tighter plan with fewer gaps.
Build the QBR around decisions, not updates
Start with the commitments made in the last review. Then show what shipped, what changed in account behavior, and what needs executive attention now. That sequence keeps the conversation tied to outcomes and makes it easier to justify a renewal motion, services recommendation, or expansion path.
A practical build looks like this:
- Map the timeline to account objectives: Anchor each quarter to the customer’s stated business goals, not your internal activity list.
- Pull from the systems your team already uses: Sync CRM opportunity and renewal data, product adoption signals, support themes, and success plan milestones into one timeline view.
- Separate signal from noise: Show a small number of moments that changed account health, such as rollout completion, a usage drop, a support escalation, or a stakeholder change.
- Add an action layer for next quarter: End each timeline section with an owner, target date, and expected business result.
- Prepare two views: One executive summary for decision-makers and one drill-down layer for admins, power users, or project leads.
There is a real trade-off here. A dense dashboard gives the internal team more context, but it can slow the customer conversation and hide the main decision. I usually keep the live version detailed for account prep, then present a simplified customer-facing view with only the milestones that explain risk, value, and next steps.
Interactivity helps, but only if it supports the workflow. Teams do not need visual effects. They need a timeline that can zoom from quarter-level themes into specific events like adoption spikes, unresolved tickets, roadmap dependencies, or expansion triggers. Browser-based timeline tools now make that easier for non-design teams, which is one reason more revenue organizations are replacing static review decks with interactive account narratives.
Send the live QBR deck before the meeting and track which sections the customer opens. That pre-read data gives the CSM or account manager a better agenda. If the customer spends time on roadmap items, low adoption periods, or renewal milestones, the team can address those topics directly instead of spending half the meeting finding them.
Top 10 Creative Timeline Ideas Comparison
| Item | 🔄 Implementation Complexity | ⚡ Resource Requirements | 📊 Expected Outcomes | 💡 Ideal Use Cases | ⭐ Key Advantages |
|---|---|---|---|---|---|
| Deal Progression Timeline with Live Win Probability | Medium, CRM webhooks and data hygiene needed | Moderate, CRM access, Encelade widgets, periodic refresh | Improves forecast accuracy; shortens sales cycles | Pipeline reviews for Enterprise/Mid-market AEs | Real-time win probabilities; reduces manual updates |
| Customer Success Milestone Timeline for Onboarding | Medium, coordination across sales and CS | Moderate, Gantt + Google Sheets, video assets | Faster consensus; smoother handoffs; higher NPS | Implementation-heavy deals; presales→CS transitions | Clear ownership, measurable milestones, co-presentable |
| Competitive Displacement Timeline | Medium–High, ongoing competitor research and legal review | Moderate, analytics, content curation, interactive widgets | Accelerates competitive wins; improves deal quality | Competitive sales positioning; objection handling | Historical differentiation narrative backed by proof points |
| Product Roadmap Timeline with Feature Release Cadence | Low–Medium, PM tool integration and approval gating | Moderate, Jira/Asana feeds, product & marketing input | Increases deal size; reduces buyer hesitation | Strategic buyers evaluating long-term fit | Demonstrates future value; ties roadmap to buyer needs |
| Sales Cycle Velocity Benchmark Timeline | Medium, requires historical CRM segmentation and modeling | Moderate, data exports, spreadsheets, analytics tooling | Better forecasting; identifies bottlenecks; speeds closures | Sales management and internal forecasting | Data-driven benchmarks and deviation alerts |
| Customer Journey Map Timeline | Medium–High, needs cross-functional research and validation | High, customer interviews, mapping workshops, content | Higher close rates; tailored engagements; better CS onboarding | Enablement, presales strategy, complex buying groups | Aligns teams; anticipates objections; customer-centric narrative |
| Implementation Timeline with Resource Allocation | High, detailed dependencies, critical-path planning | High, PS involvement, resource planning, live Sheets | Reduces post-sale churn; clarifies scope; improves resourcing | Large enterprise implementations and contract negotiations | Demonstrates project management capability; clarifies responsibilities |
| Market Trend Timeline Showing Industry Shifts | Medium, continuous analyst research and curation | Moderate, analyst reports, data feeds, persona tailoring | Creates urgency; supports premium pricing and strategic sells | Thought-leadership pitchbooks; C-suite conversations | Positions solution within market shifts; builds credibility |
| Customer Reference Timeline Showing Customer Success Stories | Low–Medium, needs permissions and fresh metrics | Moderate, case studies, videos, filtered reference data | Builds credibility; accelerates decisions; improves deal quality | Deal-specific proof points; industry- or size-focused outreach | Social proof and customizable, relevant success stories |
| Quarterly Business Review (QBR) Timeline Dashboard | Medium, multiple live feeds and templating required | High, API integrations, CSM prep, account-specific metrics | Increases NRR; uncovers expansion; reduces churn | Account QBRs for retention and expansion | Data-driven reviews; positions CSM as strategic partner |
Turn Your Timeline into a Deal Accelerator
A timeline isn’t just a way to show dates. In a revenue context, it’s one of the clearest ways to turn a presentation into a working system for persuasion, planning, and alignment. When teams build timelines as live narratives instead of static graphics, they can answer the questions buyers ask. What happens next? Who owns it? Where could this slip? What proof do we have that the plan is credible?
That’s why the best creative timelines ideas don’t start with visual style. They start with operational intent. A deal progression timeline helps an AE defend a close plan. An onboarding timeline lowers delivery anxiety before signature. A competitive displacement timeline explains why the status quo stopped making sense. A QBR dashboard turns a customer meeting into a decision-making session instead of a recap.
The practical advantage is consistency. When timeline slides pull from CRM fields, Sheets, API feeds, or managed reference data, the story stays current without forcing reps or CSMs to rebuild decks by hand. That reduces version drift. It also improves trust inside the room because the presenter isn’t narrating over stale screenshots or fuzzy assumptions. The timeline becomes a shared source of truth.
Interactivity strengthens that effect when it’s used with discipline. Buyers don’t need novelty for its own sake. They need the ability to move between summary and detail without losing the thread. A clickable roadmap, a filtered reference timeline, or a live implementation plan does exactly that. It supports the conversation instead of slowing it down.
There’s also a strategic benefit that sales teams often overlook. Good timelines shape expectations early. They make customer effort visible. They expose dependencies before they become objections. They help stakeholders align around a realistic sequence of decisions. In many deals, that kind of clarity is what keeps momentum alive.
If you’re deciding where to start, don’t redesign every deck at once. Pick the sales challenge your team faces most often. If deals stall late, build the deal progression timeline. If implementation anxiety is hurting win rates, start with onboarding or resource allocation. If your CSM team is running bloated QBR decks, consolidate them into one timeline dashboard with live data. One well-built timeline usually creates more impact than ten prettier static slides.
Encelade fits this motion well because it supports the workflows revenue teams need. You can build web-native decks, connect live data from Sheets or APIs, use Gantt and other interactive widgets, apply brand-safe themes, collaborate across sales and post-sales, and export to PDF or PPTX when stakeholders need offline formats. That combination matters because the slide isn’t the asset anymore. The working narrative is.
A timeline should help your team move a decision forward. If it doesn’t change how the buyer understands risk, momentum, ownership, or value, it isn’t doing enough. Build one timeline that updates itself, earns attention, and survives past the meeting. Then make that your new standard.
If your team is still rebuilding timeline slides by hand, Encelade gives you a faster way to turn CRM notes, spreadsheets, product data, and research into interactive, on-brand sales decks. Revenue teams can use live data connections, Gantt widgets, browser-based editing, and shareable links to create timelines that stay current through the deal cycle, implementation, and ongoing customer reviews.