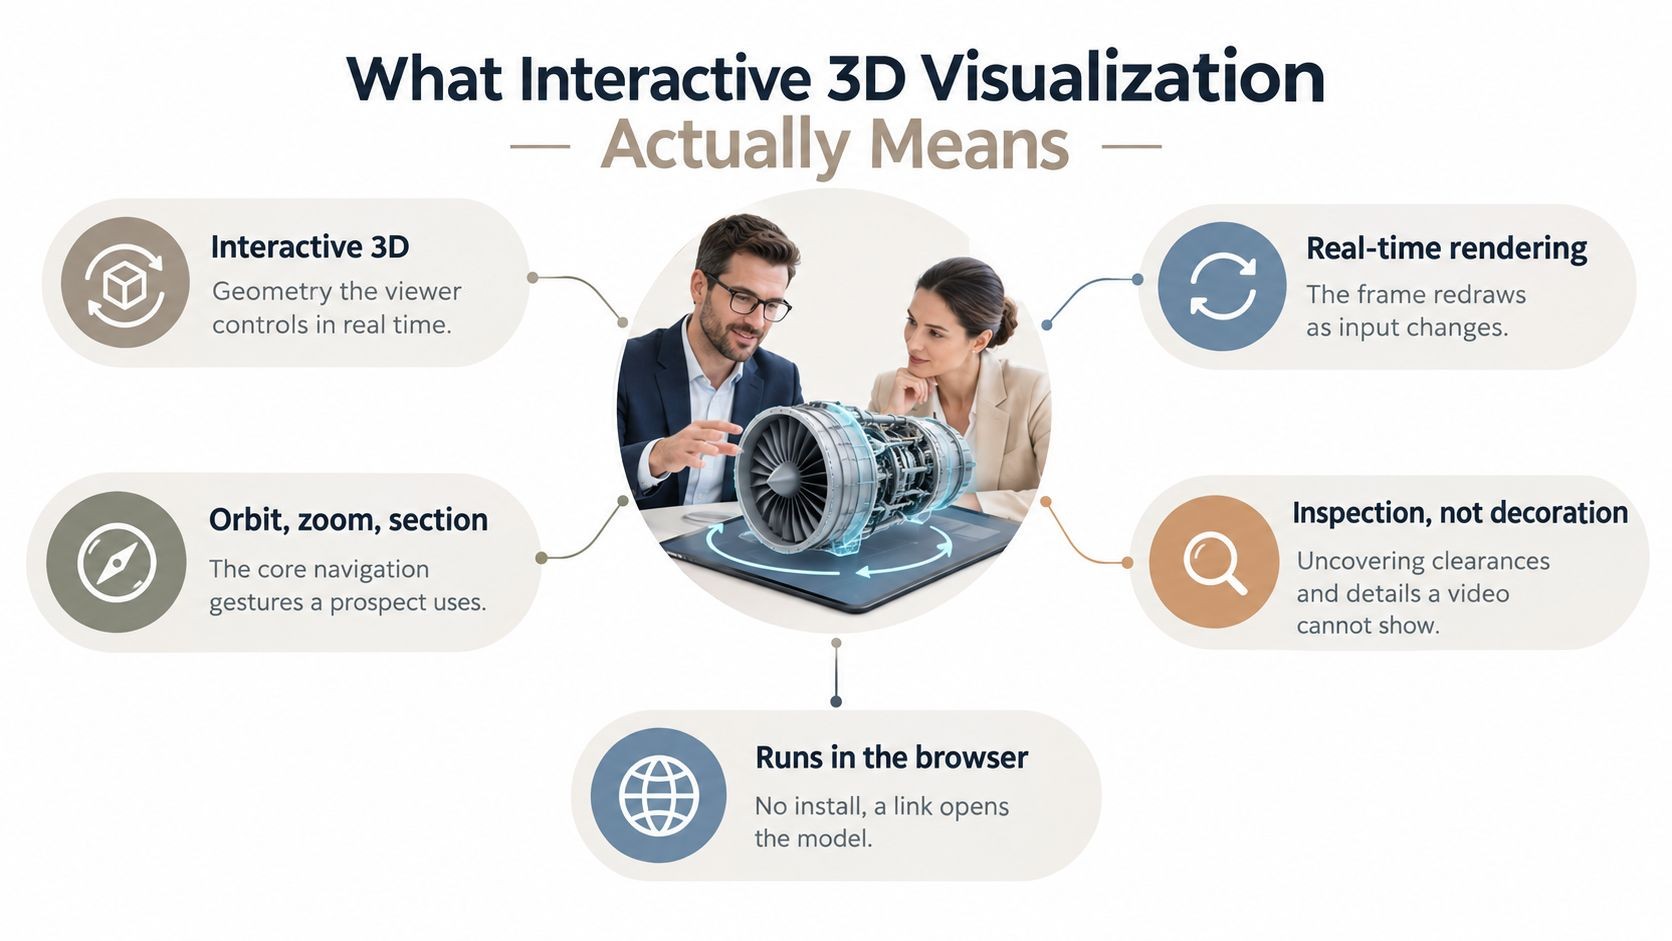
You’re in a buyer call, the prospect has a rival’s website open on a second screen, and the rep in the room is trying to explain a competitive analysis presentation from a stale PDF last touched months ago. The competitor’s pricing has changed, a new launch isn’t in the deck, and the buyer’s real question, whether switching is worth the disruption, still hasn’t been answered. That’s the moment a polished slide file stops behaving like a decision tool and starts behaving like a liability.
A strong deck doesn’t try to win on volume. It wins by showing what’s changed, what matters to the buying committee, and what action should happen next. That’s why the best competitive work feels less like a report and more like a live artifact in the deal room.
Table of Contents
- The Moment a Static Deck Stops Working
- Defining the Decision and the One Takeaway
- Choosing Metrics and Data Sources That Stay Current
- Building the Slide Story From Governing Thought to Action
- Visualizations and Interactive Elements That Move a Buyer
- Web-Native Delivery and Automation for Revenue Teams
- Delivery, Follow-Up, and Keep the Deck Alive
The Moment a Static Deck Stops Working
The failure usually shows up fast. A rep opens a 40-slide competitor PDF, jumps to the feature comparison, and the buyer interrupts with a simple question about a rival’s packaging. The answer is somewhere in the rep’s head, not in the deck, and the deal loses momentum right there.

That isn’t a design problem. It’s a freshness problem, and a decision problem. A static comparison sheet is built once and then drifts quietly out of date, while the buyer keeps checking claims against whatever they can pull up in the moment. In sales, that means a stale deck is already behind the buyer before the first objection lands.
The pressure points are obvious in live calls. Competitors release products faster than many teams refresh their decks. Buyers validate claims against public sources while the meeting is still happening. Procurement teams also expect artifacts they can track, forward, and revisit without asking for a new attachment every time the story changes. If the presentation can’t absorb those realities, it becomes decoration.
Practical rule: if a buyer can fact-check your deck mid-call, the deck needs to survive that moment without turning defensive.
A better pattern is to treat the deck as a decision-support artifact. Use it to answer the live question in front of the room, then make the next step easy to document. For teams experimenting with interactive delivery, this guide to interactive presentation software is a useful reference point for how modern decks behave in motion.
Defining the Decision and the One Takeaway
Before a single slide gets built, define the decision in one sentence. The cleanest version is simple: after this artifact, the buyer should choose us over Competitor X for Reason Y. If that sentence can’t survive scrutiny from the economic buyer, technical evaluator, champion, and end user, the deck is trying to serve too many masters.
Each stakeholder needs a different kind of proof. The economic buyer wants risk reduced and return made obvious. The technical evaluator wants compatibility, security, and implementation clarity. The champion wants something they can repeat internally without overselling. The end user wants proof the choice won’t create friction in daily work.
Pressure-test the governing thought
A good governing thought acts like a spine. It tells the story what to defend, what to omit, and what to put on its own slide. If the thought is too broad, the deck turns into a trivia contest. If it’s too narrow, the buyer feels cornered.
A practical decision brief can stay tight:
- Trigger event. What changed that forced the comparison now.
- Primary competitor. Which rival is in the deal.
- Switching cost. What the buyer would have to give up or change.
- One thing that must be true after the meeting. The next commitment, not the final close.
- Proof needed. The evidence the committee will ask for, in order.
That brief keeps the presentation tied to a real revenue motion instead of vanity differentiation. It also makes the story falsifiable, which matters because buyers can feel when a deck is built to impress rather than decide.
The strongest decks don’t argue that the company is better at everything. They argue that one specific switch is justified for this specific buyer.
A final checklist helps keep the takeaway honest. It should be specific, falsifiable, and directly tied to a revenue outcome. If the statement could fit any competitor, any account, or any meeting, it’s not useful enough yet.
Choosing Metrics and Data Sources That Stay Current
A serious competitive deck pulls from several metric families, but not every source deserves the same trust level. Product capability, pricing and packaging, customer evidence, analyst sentiment, security posture, and recent momentum all belong in the story, yet they decay at different speeds. The job is not to collect everything, it’s to choose claims the buyer can still believe when the deck is opened again next week.
Freshness beats completeness
Public pricing pages move fast, and so do release notes, hiring posts, and review platforms. Those are useful because they show movement, but they also age quickly. SOC 2 reports and case studies usually hold up longer, although they still need a human check for relevance to the specific buyer context.
The best teams tier sources by freshness. Live or automated sources sit at the top, monthly refresh sits in the middle, and quarterly audit covers the slower-moving proof points. That cadence keeps the narrative current without turning the deck into a maintenance burden. It also supports the kind of live, decision-oriented view of competitor movement that many static templates miss.
If you’re wiring this into a working system, real-time data sync is the concept to borrow. The point isn’t software for its own sake. The point is keeping claims current enough that a rep doesn’t have to apologize for stale proof.
Source rule: if a metric changes often, it shouldn’t live in a slide that rarely gets touched.
| Metric family | Primary sources | Decay risk | Refresh cadence |
|---|---|---|---|
| Product capability | Release notes, product pages, demos | High | Live or automated |
| Pricing and packaging | Pricing pages, quotes, sales collateral | High | Live or automated |
| Customer evidence | Case studies, references, reviews | Medium | Monthly review |
| Analyst sentiment | Analyst writeups, category coverage | Medium | Quarterly audit |
| Security and compliance | SOC 2 reports, trust centers | Lower | Quarterly audit |
| Recent momentum | Hiring, launches, funding, channel changes | High | Monthly refresh |
A useful rubric is straightforward. First, ask whether the metric is buyer-relevant. Then ask whether it can be falsified. Finally, ask whether it supports the governing thought. If it fails any one of those tests, it belongs in research notes, not in the deck the buyer will carry into the next meeting.
Building the Slide Story From Governing Thought to Action
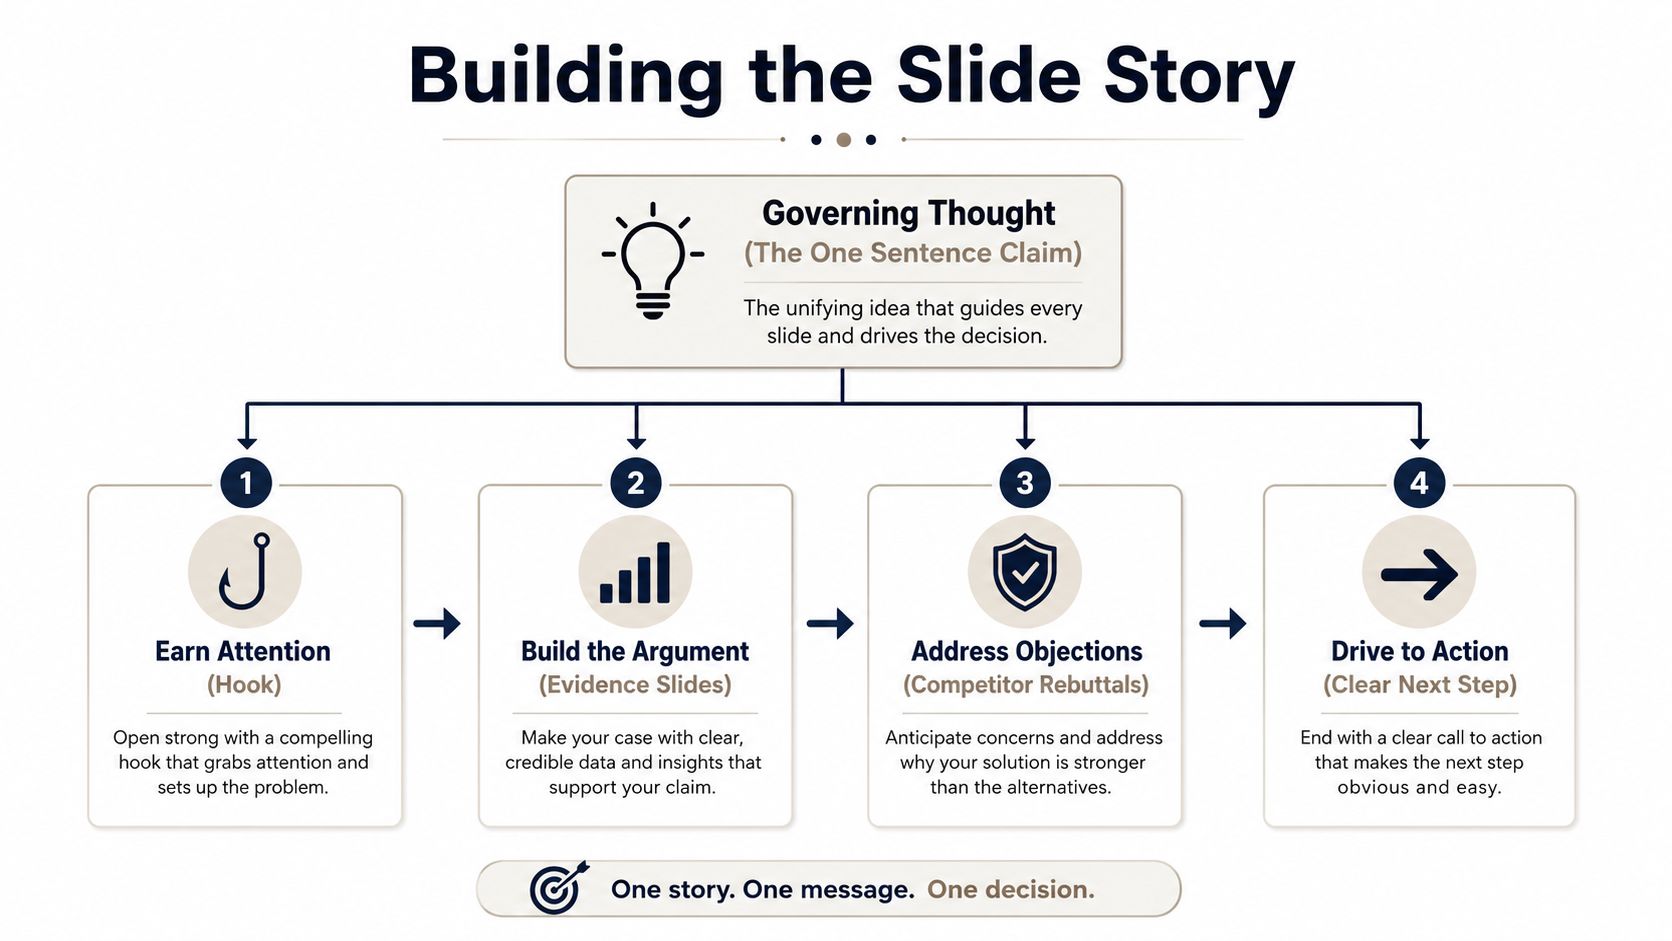
The slide order should feel inevitable once the governing thought is set. That means every slide earns its place inside one argument, not inside a pile of comparisons. The opening has to orient the buyer quickly, the middle has to prove the point, and the ending has to tell the room what happens next.
Use three acts, not a pile of sections
Act 1 is framing. Three slides is usually enough to define the buyer’s status quo, the competitor under pressure, and the decision at stake. Keep that portion tight, because engagement data from Storydoc’s analysis of 1.3 million presentation sessions shows that 31% of the people who bounce from a deck do so within the first 10 seconds, and 82% of those who make it past the first three slides finish the deck. If the opening misses, the rest barely matters.
Act 2 is evidence. The deck earns trust with five to seven slides. Use one slide for where competitors are gaining, one for where they’re exposed, and one for the wedge you can credibly own. Keep objections visible rather than burying them in a footnote, because buyers respond better when concerns are named openly.
Act 3 is recommendation. Collapse the argument into the next step, the owner, and the date. That final slide should feel like a working decision memo, not a closing logo page.
A few guardrails keep the story from sprawling:
- Cap the deck at ten to twelve slides. That’s usually enough room for a clean argument without turning the presentation into a research dump.
- Signal transitions explicitly. Buyers shouldn’t have to guess when the story moves from framing to proof.
- Put one objection per slide when the issue matters. A crowded appendix rarely gets discussed openly in the meeting.
One executive-facing guide recommends keeping the core presentation to 15 to 20 minutes, with the rest reserved for discussion, and sending a short briefing note ahead of time so leaders can prepare. That rhythm works because the deck arrives ready to debate, not just to be read.
Practical rule: if a slide can’t be explained in one breath, it probably contains two ideas.
Visualizations and Interactive Elements That Move a Buyer
A buyer’s first question is rarely, “Can I see more data?” It’s usually, “What should I notice here?” The right visual answers that instantly. The wrong one forces the room to read, compare, and decode before the conversation can move forward.
Match the visual to the question
A quadrant plot works well when you need to show competitor momentum against switching friction. It makes positioning obvious without making the buyer work for it. Small multiples are better when three or more rivals need to be compared on the same criteria, because stacked bars can blur the story. Feature toggles help technical evaluators isolate the integrations, security controls, or AI capabilities that matter to their environment.
Clickable competitor cards are especially useful in live reviews. Instead of forcing the rep to flip through static logos, each card can reveal the latest launch, pricing change, or reference customer on demand. A live ROI calculator can reopen a stalled evaluation because it changes the conversation from opinions to the buyer’s own math.
| Buyer question | Best visual | Why it works |
|---|---|---|
| Who’s moving fastest | Quadrant plot | Shows momentum and switching friction together |
| Where do rivals differ on the same criteria | Small multiples | Keeps comparisons clean across several competitors |
| What matters to our technical evaluator | Feature toggle | Lets them isolate the stack-specific details |
| What changed since the last call | Clickable competitor cards | Surfaces fresh updates without adding clutter |
| Is the switch worth it | Live ROI calculator | Moves the discussion into buyer-specific numbers |
The rule is simple. If a visual doesn’t help someone make a decision, it’s just decoration. Interactive elements matter because they let the buyer work with the evidence instead of passively consuming it. Research on interactive formats backs this up: a study of interactive, participation-driven conferences found they raised audience engagement and satisfaction without a significant increase in preparation time compared with traditional slide lectures, which is exactly the kind of trade-off revenue teams need to hear.
Web-Native Delivery and Automation for Revenue Teams
A PDF deck dies the moment it gets forwarded. The file might still open, but the context is gone, the version is stale, and nobody knows which slide the buyer spent time on. A web-native deck keeps working because it stays link-based, trackable, and easier to update.
That matters for competitive work because the content changes as the deal changes. A rep can swap in the competitor named on the latest call, update pricing from a current source, and send a tracked link instead of a static attachment. One option that supports that workflow is Encelade, which turns research, CRM notes, spreadsheets, and documents into interactive, web-native decks with live data connections and sharing links. Used well, that kind of platform turns a competitive analysis presentation into something the team can keep revising as the buyer’s questions evolve.
Why automation changes the economics
Automation helps because the biggest waste in competitive enablement is manual rework. If the deck is rebuilt every time a new rival appears or a pricing page changes, the team will eventually stop maintaining it. If the data can refresh through a connection rather than a copy-paste cycle, the deck stays usable longer.
A few practical workflows matter here:
- Swap in account-specific competitors. Reps shouldn’t present a generic comparison if the buyer has already named a rival.
- Pull current numbers from a system of record. That lowers the risk of stale claims.
- Route views through tracked links. Sales can see who opened what, and when.
- Connect deck behavior to CRM signals. A stage change can trigger a different competitor emphasis.
The most useful part is the feedback loop. If a champion spends extra time on the pricing comparison and ignores the integrations page, the next follow-up should reflect that. If the technical evaluator opens the security slide twice, the next meeting should lead with implementation detail, not brand story.
The point of web-native delivery isn’t novelty. It’s reducing version drift, keeping the story current, and making the deck a working asset instead of a file that ages in someone’s inbox. REST API integration is one practical path for teams that want the presentation to update from the systems they already trust.
Delivery, Follow-Up, and Keep the Deck Alive
The handoff matters as much as the deck itself. A rep who walks into a meeting with a one-page briefing note, clear competitor pressure, and the two slides most likely to get revisited is prepared for a real conversation. A rep who just forwards the file is hoping the buyer will do the work.
Build the follow-up into the motion
Start with the briefing note. It should summarize the competitor named in the deal, the decision criteria the buyer already voiced, and the slide most likely to matter after the call. That note gives the rep a quick way to stay consistent across the team.
Then use a simple follow-up cadence. At 48 hours, send the specific slide the buyer hovered on, not the whole deck again. At one week, send an updated tracked link to the section that changed. At the next buying milestone, revisit the competitor claims that still matter and retire the rest. That sequence keeps the conversation active without flooding the inbox.
Analytics close the loop. Track view time, slide order, and CTA clicks so the team can see which claims are gaining traction and which ones are falling flat. When a competitor tile gets reopened repeatedly, that’s a signal to sharpen the proof or update the narrative. When nobody reopens a slide, it needs pruning.
Quarterly cleanup keeps the artifact credible. Remove outdated screenshots, refresh pricing benchmarks, and retire slides that no one revisits. Assign an owner to each competitor tile so stale content has nowhere to hide. That ownership model sounds small, but in practice it’s what keeps a competitive analysis presentation from turning into an archive.
Keep the deck alive, or the buyer will quietly decide it isn’t worth revisiting.
The best teams treat this as part of revenue operations, not a side project. They don’t build the deck once and hope it sticks. They keep it in motion, tied to the account, tied to the update cycle, and tied to the next conversation that can move the deal.
If you want your competitive decks to stay current, track buyer behavior, and update without manual rebuilds, take a look at Encelade. It’s built for revenue teams that need live, web-native presentations instead of static files that go stale after the first forward. Use it to turn competitor research, CRM notes, and changing deal context into a deck your team can keep using in the field.