A sales lead walks into an executive meeting with last week's pipeline total on the screen. The hiring plan gets approved, then the CRM finishes refreshing and the pipeline is sharply lower. Nobody deliberately misled anyone. The team made a decision from a number that had already gone stale.
Real-time data sync closes that gap between what an operational system knows and what people, dashboards, spreadsheets, and AI tools can see. The hard part isn't connecting two systems once. Production teams must keep changes complete, ordered, secure, observable, and recoverable when replication lag, quota ceilings, schema drift, or destination backpressure appear.
This guide takes a practical route through the problem. You'll learn what synchronization means, how CDC, event streaming, WebSockets, and polling differ, how latency interacts with consistency, how a live revenue deck can work, and which controls keep a sync pipeline from becoming the outage source.
Table of Contents
- Why Stale Numbers Hurt and What Real-Time Sync Fixes
- Defining Real-Time Data Sync Across Batch, Near Real-Time, and True Real-Time Layers
- Core Architectures and Sync Patterns Compared
- Latency vs Consistency Trade-offs in Practice
- Real-World Example: Keeping a Live Deck in Sync
- Debugging and Monitoring the Sync Pipeline
- Security, Scaling, and Operational Best Practices
- Putting It All Together: a Sync Decision Checklist
Why Stale Numbers Hurt and What Real-Time Sync Fixes
A sales manager approves new hires after seeing a strong pipeline in the CRM. Finance is working from a spreadsheet with fewer deals, and leadership sees an overnight dashboard export that reflects an even earlier state. Each value may have been correct when it was captured. The decision becomes risky because those systems describe different moments as if they were the same instant.
Start by asking: how old can this data be before the decision becomes unsafe? A hiring plan, inventory commitment, customer-support escalation, or revenue forecast may require a fresher view than a monthly report. Real-time data sync sends source changes toward downstream consumers as they occur, instead of waiting for a scheduled extraction.
Practical rule: Define acceptable staleness before choosing a tool. "Real time" only has meaning relative to the decision using the data.
A production sync pipeline has three jobs:
- Detect the change: Capture a committed insert, update, or delete from the source.
- Deliver the change: Pass it through durable transport that can retry without losing records.
- Apply the change: Write it to the destination, preserve the required order, and expose failures for investigation.
Reliability is what makes people trust the result, even when latency looks acceptable. A dashboard that refreshes quickly while dropping an important record can mislead more severely than a slower dashboard that clearly reports its freshness. Microsoft's change data capture documentation describes a built-in latency between the time a change is committed to a source table and the time it becomes available to downstream consumers, as covered in its overview of change data capture. That framing turns freshness into a measured operating condition rather than a vague promise.
The same measurement can reveal production trouble early. A growing lag queue may point to a quota ceiling, schema drift, destination backpressure, or a consumer that cannot process changes quickly enough. If the pipeline retries without limits, it can consume more capacity and become the outage source itself.
Choose the freshness users need, then set consistency expectations, failure handling, and monitoring around that decision.
Defining Real-Time Data Sync Across Batch, Near Real-Time, and True Real-Time Layers
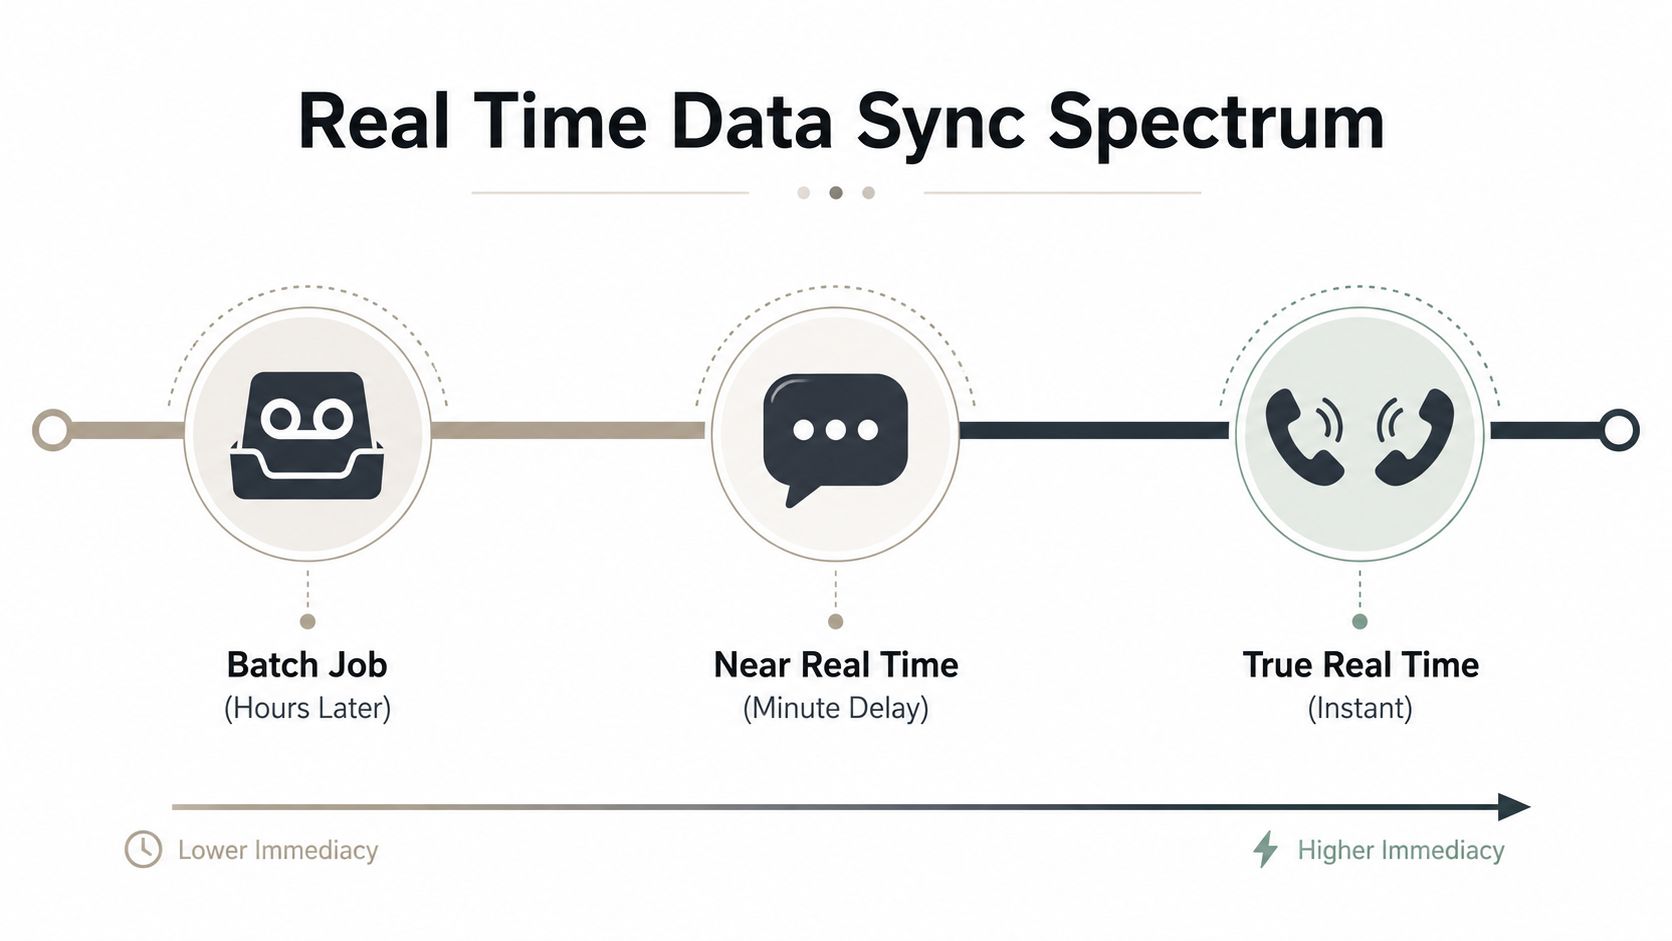
Data synchronization sits on a spectrum from scheduled batches to continuously delivered events. The label matters because it sets expectations for how current a destination should be and what happens when the pipeline falls behind.
- Batch: A scheduled process collects changes and applies them together. An overnight finance model may show yesterday's revenue movements.
- Near real time: A continuous or frequent process delivers updates after a short processing window. A dashboard may refresh soon after transactions arrive, while still showing temporary lag.
- Real time: An event reaches the consumer quickly enough for a user or workflow to treat the update as immediate. "Immediate" depends on the decision, network, processing time, and destination workload.
A finance team preparing a leadership meeting sees this difference plainly. An overnight spreadsheet model and a KPI dashboard wired to current transactions can show different revenue totals. Neither system has to be wrong. They are answering the same question at different points in time, and that mismatch chips away at confidence in the numbers.
For an interactive business workflow, a useful working definition has three properties:
- Fast propagation: End-to-end visibility is commonly designed around a low-second or sub-second experience. Real-time push is often targeted at roughly 50 to 200 milliseconds under good network conditions, while local, offline-first reads and writes can stay in the low single-digit milliseconds because they use the local database directly.
- Durable delivery: A temporary consumer failure should not erase a change. Retained events, acknowledgments, retries, or another recovery mechanism must preserve the work.
- Ordered or replayable events: Downstream services need sequence information to reconstruct state when messages arrive late, repeat, or require replay.
A fast notification without durable application is only a signal. A durable queue without a freshness target is only storage. Real-time data sync combines delivery with usable destination state, then measures delay from committed source change to that state. That measurement also exposes replication lag, quota ceilings, schema drift, and the point where recovery work can make the pipeline an outage source.
Core Architectures and Sync Patterns Compared
The right pattern depends on where truth lives, how many consumers need the change, and what users do with it. CDC reads changes from a database or source platform, event streaming distributes those changes across services, WebSockets or server-sent events push updates to a browser, and polling asks the source whether anything changed.
| Pattern | Typical latency | Consistency guarantee | Operational cost | Best fit workload |
|---|---|---|---|---|
| Change data capture | Low latency, often sub-second when tuned | Ordered source changes with replay and reconciliation | Medium to high | Database-to-warehouse or source-of-truth replication |
| Event streaming | Low latency, with buffering for bursts | Consumer-defined processing and replay semantics | High | Service-to-service fan-out and multiple downstream consumers |
| WebSocket or server-sent push | Interactive, connection-dependent | Usually application-level state handling | Medium | Collaborative interfaces, live dashboards, notifications |
| Polling | Poll interval plus processing time | Easy to reason about, but can miss or duplicate work without cursors | Low to medium | Cheap, low-frequency checks and systems without events |
CDC earns its keep when the source database is authoritative. It captures committed changes instead of repeatedly scanning an entire table. A warehouse, lake, or operational replica can then apply inserts, updates, and deletes while preserving enough metadata for replay and reconciliation. CDC is especially useful when a product team needs downstream freshness but can't afford to make every consumer query the transactional database directly.
Event streaming dominates when one change has many destinations. A customer update might feed search, billing, notifications, analytics, and an internal service. An event bus lets each consumer process the same change independently, with its own retry and backfill policy. The trade-off is operational ownership. Teams must manage topics, consumer groups, retention, ordering boundaries, and schema compatibility.
WebSockets win at the presentation edge. A collaboration tool can push cursor movement, document changes, or presence information to connected browsers. The socket doesn't replace a durable source-of-truth pipeline. It delivers an interactive view, while the backend still needs persistence, conflict handling, and recovery.
Polling still has a place. A low-frequency integration may be cheaper and safer to operate when the data can wait. But polling needs a cursor, backoff, deduplication, and rate-limit handling. Teams evaluating a REST-based integration can use this REST API integration guide to think through source access and downstream delivery.
Use CDC for authoritative replicas, event streaming for fan-out, WebSockets for interactive experiences, and polling only when the data can wait.
Latency vs Consistency Trade-offs in Practice
Real-time synchronization isn't a single setting that makes every reader see the same value instantly. It's a choice between how quickly a system exposes a change and how much coordination it performs before declaring that change final.
Two coworkers editing the same document make the tension easy to see. One system shows each keystroke immediately, but two edits at once can overwrite each other. Another system waits, compares both versions, and merges them carefully. The second approach protects correctness, but users feel the delay.
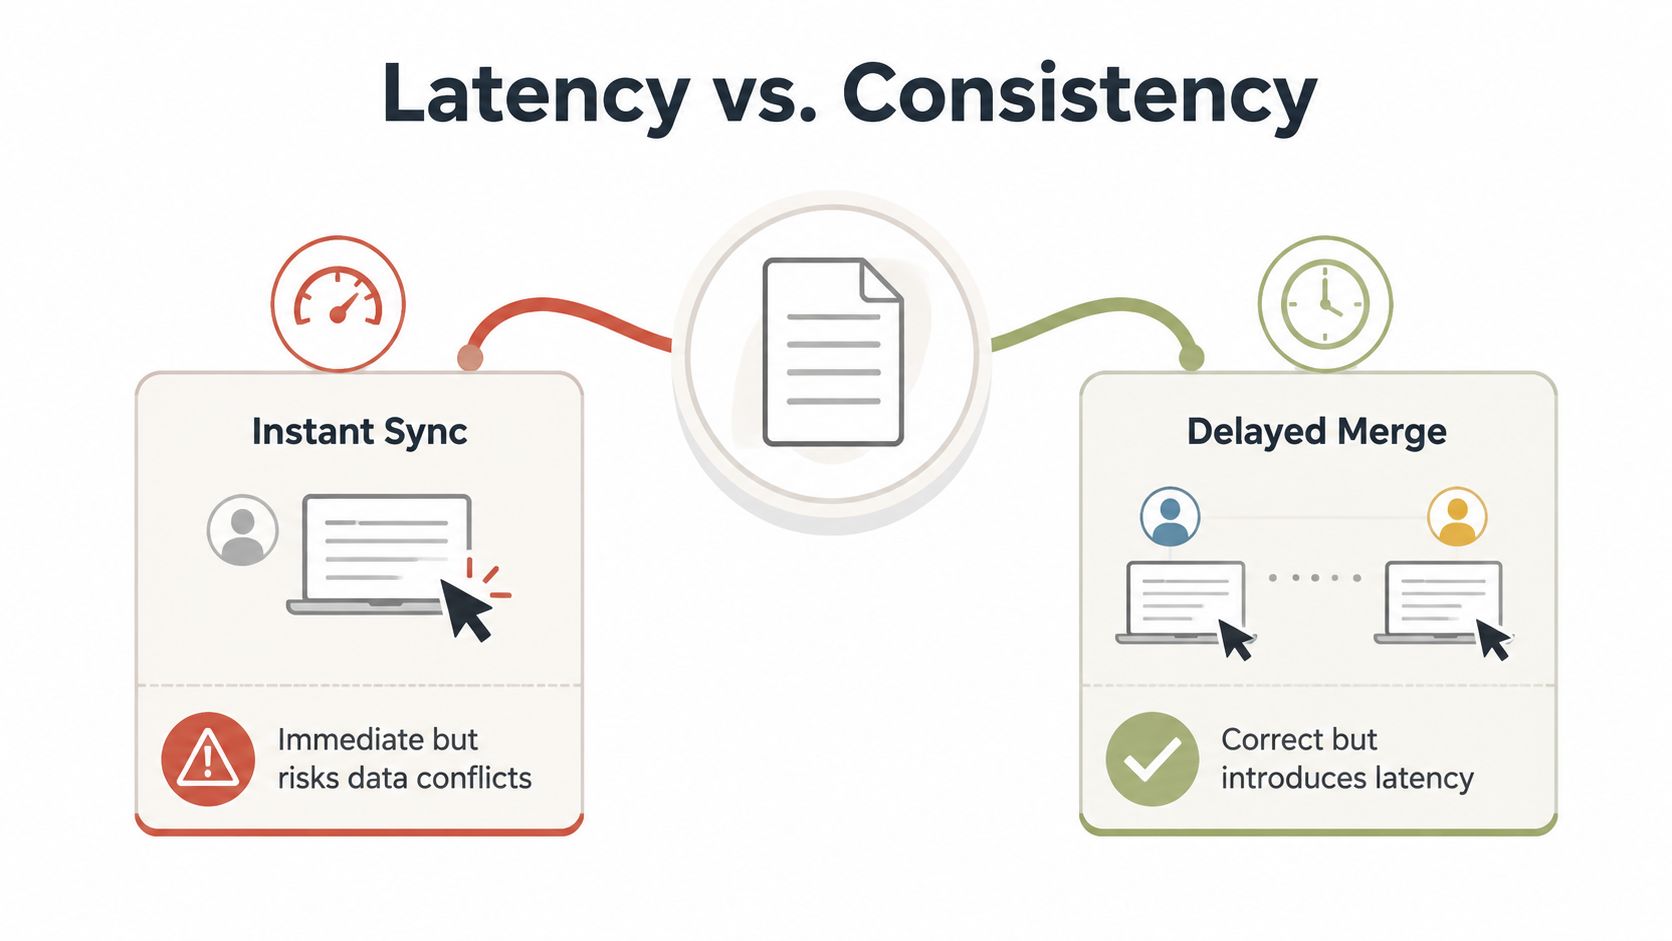
Strong consistency means readers see the latest committed write according to the system's consistency contract. That model suits inventory reservations, billing status, entitlement checks, and other money or access paths where a temporarily divergent value can cause harm. Coordination can add latency, but the system makes correctness the priority.
Eventual consistency allows different readers to see different values briefly while updates propagate. That trade-off works well for analytics dashboards, trend views, search indexes, and many chat or notification surfaces. The consumer needs a freshness window and a visible way to handle "updating" or "last refreshed" states.
CRDTs offer another option for distributed editing. A Conflict-free Replicated Data Type carries enough structure for separate replicas to merge compatible changes deterministically. Think of two people writing on separate copies of a form. Instead of asking one person to win every conflict, the data structure records operations in a way that allows both copies to converge when they reconnect.
Choose the model from the business consequence, not from the transport's novelty:
- Money and regulated data: Prefer strong consistency and explicit transaction boundaries.
- Dashboards and reporting: Use eventual consistency with a clear freshness indicator.
- Collaborative edits: Consider CRDT-backed merging when users can update the same object from multiple devices.
- Interactive displays: Set a latency budget first, then decide which temporary divergence the interface can tolerate.
For dashboard design, our real-time data dashboard guidance provides a useful product lens. The short rule is simple: the latency budget dictates the delivery pattern, while data criticality dictates the consistency level.
Real-World Example: Keeping a Live Deck in Sync
A revenue team runs weekly forecast reviews in slides. The team copies pipeline figures from Salesforce into a Google Sheets forecast tab, pastes charts into the deck, and discovers by Tuesday that broken links and new deal activity have made the slides stale. Friday morning becomes a ritual of exports, reconciliations, and last-minute number checks.
A live Encelade deck can pull from both the Google Sheets forecast and a Salesforce pipeline metric in one presentation workflow. The revenue operations owner points a statistic card at a Salesforce aggregate — total pipeline ARR, say — drives the stage-by-stage breakdown and charts from the forecast sheet, and embeds both in the deck. As the underlying data changes, the presentation refreshes from the connected sources instead of relying on a manual paste.
That workflow changes the artifact's role. The deck is no longer a static snapshot created for a meeting. It becomes a presentation layer over the source data, with the source mapping and refresh behavior treated as part of the product design.
A practical setup looks like this:
- Choose the authoritative fields: Decide whether ARR comes from the CRM, the forecast tab, or a defined transformation between them.
- Map business logic explicitly: Document how stage, close date, owner, and forecast category affect the displayed total.
- Set the freshness expectation: A meeting deck may tolerate periodic refresh, while an operator dashboard may require faster visibility.
- Test the edge cases: Move a deal, remove a value, change a stage, and confirm the destination reflects the intended state.
- Share the live surface: A web-native deck stays connected, so an editor can refresh it and every recipient sees that updated version at the same link — while an exported PDF or PPTX freezes the numbers at the moment of export. Recipients view the last values an editor refreshed, so treat a periodic editor refresh as part of the workflow rather than expecting each viewer to pull live data.
The same workflow can serve programmatic consumers. Encelade's REST API can generate or refresh a deck from your own systems, and its MCP server lets an AI copilot plan or query a deck in chat, so a revenue question gets answered without leaving the conversation. Teams building the presentation layer can also review our interactive slides workflow.
The live deck doesn't eliminate governance. It makes source ownership, field mapping, freshness, and failure behavior visible enough to manage.
Debugging and Monitoring the Sync Pipeline
A sync pipeline can pass a demo and then fail during a close-period workload, a source schema change, or a destination slowdown. Treat it as a reliability service. The failure usually starts as a small delay, then grows into the outage itself.
Replication lag is the time between a committed source change and the moment it becomes visible at the destination. It behaves like a delivery queue: when new packages arrive faster than they leave, the line keeps growing. Measure that elapsed time and compare it against the freshness the business can tolerate. A dashboard may accept older data, while an operator workflow needs a near-current state.
Backpressure appears when the destination throttles writes or a consumer cannot process events quickly enough. Queue depth shows the visible symptom. Consumer throughput, retry volume, and destination response codes help identify the cause. Guidance on real-time data synchronization reliability illustrates how an unmonitored Postgres replication slot can allow WAL to accumulate until storage pressure turns lag into an outage.
Quota ceilings create another failure pattern. Polling and fan-out writes can exhaust a provider's allowance during a busy period. Google Sheets, for example, caps reads at 300 per minute per project and 60 per minute per user, and returns a 429 response once either ceiling is crossed — for a single service account the per-user limit is the one that binds first, as documented in the official Sheets API usage limits. Batch compatible writes, apply exponential backoff, and prefer event-driven updates where the workflow allows them. A simple example is a sales dashboard that refreshes one grouped request instead of issuing a separate request for every visible cell.
Schema drift occurs when a source adds, removes, renames, or changes a field before the consumer is prepared. Track parse errors, rejected records, and schema-version mismatches. An unknown field should trigger a visible warning rather than disappear. A renamed field also needs review, because matching names do not prove that the business meaning stayed the same.
| Failure mode | What breaks | Key metric | Alert threshold |
|---|---|---|---|
| Replication lag | Destination reflects an old source state | Lag in seconds | Above the business freshness tolerance |
| Backpressure | Queues grow while destination writes slow | Queue depth and retry volume | Sustained growth or consumer stall |
| Quota ceiling | API calls receive throttling responses | 429 response count | Any unexpected burst, then sustained errors |
| Schema drift | Records fail validation or parsing | Parse-error and rejection rate | Any new unexplained error pattern |
A useful monitoring stack includes a lag dashboard, a dead-letter queue, alerts tied to business tolerance, and a synthetic check that compares a known source row with its synchronized counterpart. Runbooks should show how to replay events, backfill a destination, pause low-priority consumers, and communicate a partial outage.
Operational insight: A pipeline becomes dangerous when failure is silent. Every skipped record needs a visible state and an owner.
Security, Scaling, and Operational Best Practices
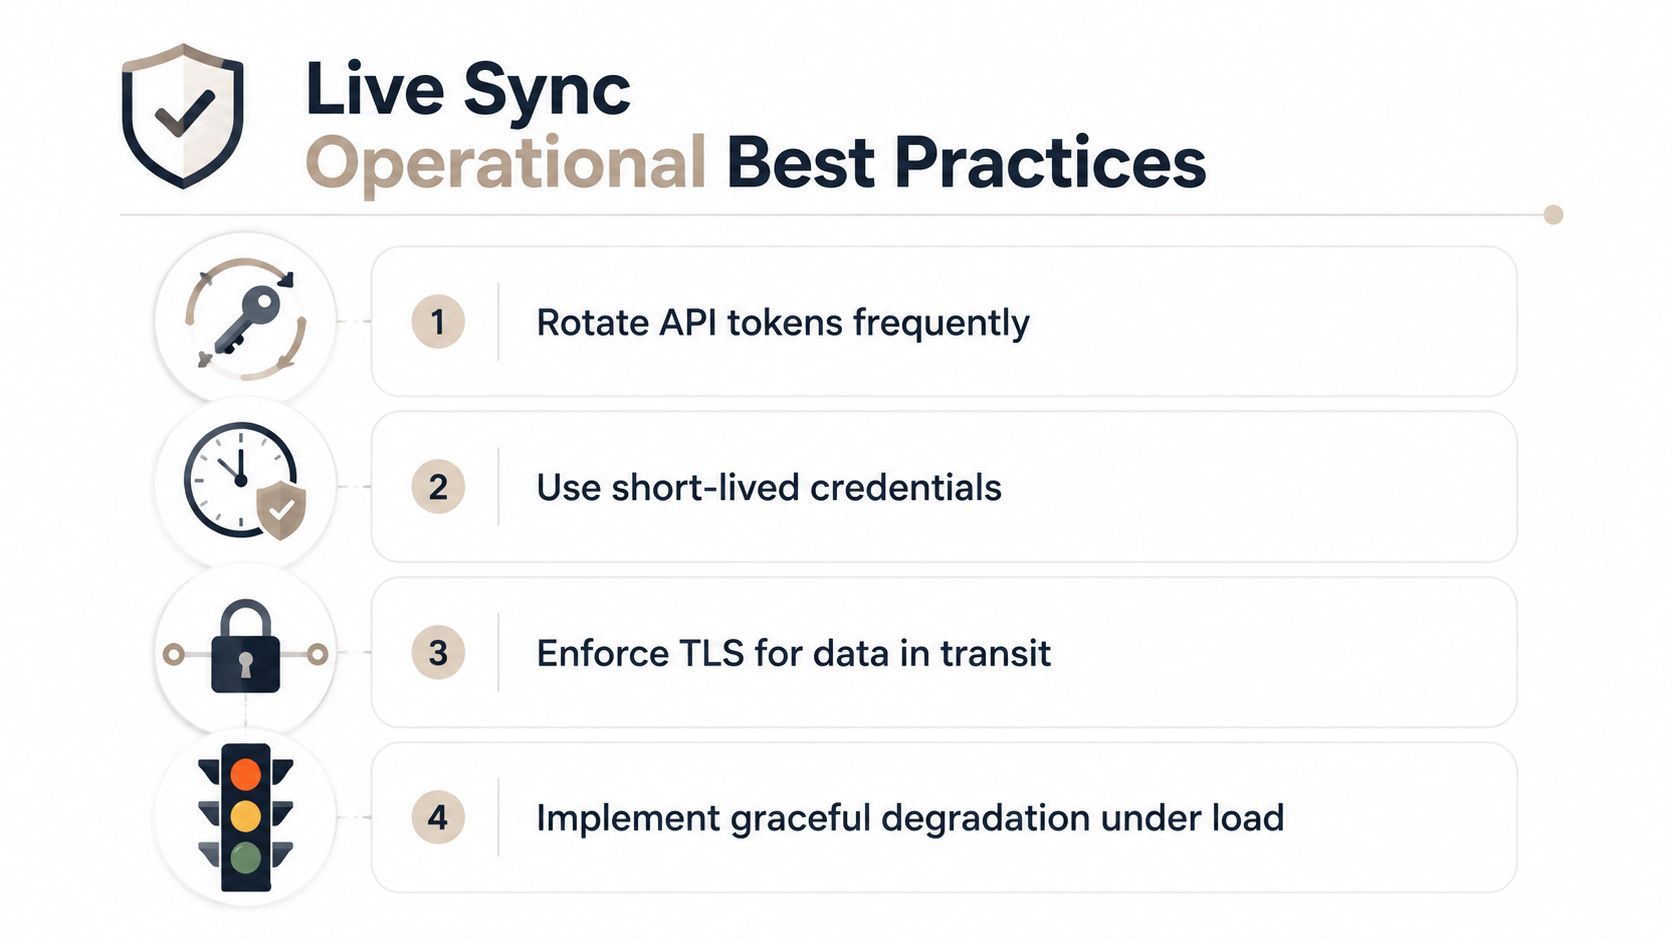
A live pipeline has continuous access to valuable systems, so security belongs in the architecture rather than in the launch checklist. Rotate API tokens, use short-lived credentials where the provider supports them, enforce TLS for data in transit, and encrypt sensitive fields at the application or storage layer when full-payload encryption isn't enough.
Authentication should identify both the service and its scope, and credentials should be limited in both. A connector that only reads selected source tables shouldn't hold broad write permissions. Separate credentials by environment and workload, and record which service used each credential so an incident investigator can reconstruct access.
Scaling requires a plan for bursts, not just average traffic. Partition event streams around a key that preserves the ordering your business needs, increase workers without creating duplicate writes, and let queues absorb temporary spikes. Idempotency keys ensure a retry doesn't create a second invoice, duplicate customer action, or repeated state transition.
Use a dead-letter queue for records that need human or targeted remediation. Infinite retries hide structural errors and can keep a consumer group busy while healthy records wait.
Design for graceful degradation
A system that can't stay current should fail safely. Serve the last-known-good value for a read-only dashboard, show its freshness timestamp, and block actions that require current state. Shed low-priority topics before critical updates, and route interactive traffic toward a cached or regional replica when the primary path is under pressure.
Measure latency percentiles rather than only averages. A production B2B data API performance guide recommends 200 to 500 milliseconds at p50 and under 2 seconds at p95 for live enrichment and synchronization workflows, with the thresholds explained in this B2B data API latency guide. The distinction matters because an average can hide a slow tail that affects a meaningful group of users.
Before launch, verify:
- Authentication: Tokens are scoped, rotated, and revocable.
- Encryption: Transport uses TLS, and sensitive fields have an appropriate encryption strategy.
- Idempotency: Retries use stable event or operation identifiers.
- Partitioning: Shards preserve required ordering without creating a single hot key.
- Backpressure: Queues, rate limits, and consumer pauses have defined behavior.
- Recovery: Runbooks cover replay, backfill, credential failure, schema changes, and communication.
Putting It All Together: a Sync Decision Checklist
Start with the business question, not the product label. A forecast deck, an inventory reservation, a collaborative editor, and a warehouse replica may all ask for "real time," but they need different delivery and consistency contracts.
Use this decision rubric:
- What is the maximum acceptable staleness? If a user needs immediate reaction, set a sub-second or low-second target and measure end to end. If the data supports periodic review, polling or batch may be sufficient.
- What happens if two systems disagree? Choose strong consistency for billing, inventory, permissions, and regulated records. Choose eventual consistency for analytics and reporting when a short propagation window is acceptable.
- Where does the authoritative change originate? Use CDC for database-to-replica movement, event streaming when many services need the same event, WebSockets for browser interaction, and polling when the source offers no usable event channel.
- How will the destination recover? Require durable delivery, replay, idempotent application, dead-letter handling, and reconciliation before declaring the integration ready.
- Which signals page the on-call engineer? Treat replication lag, quota consumption, queue depth, schema errors, and destination failure as first-class service objectives.
The habit that separates healthy synchronization from outage-prone synchronization is operating freshness and failure states as product requirements. A number should carry its last-updated context, a failed record should enter a visible workflow, and a delayed consumer should have a documented degradation path.
A live Encelade deck, a dashboard fed by an API, and a larger CDC pipeline follow the same discipline. Define the source, set the latency and consistency contract, make retries safe, and prove that the team can recover before users discover the gap.
Encelade connects live data from Google Sheets, Salesforce, and other business systems to interactive, web-native presentations, with a REST API and MCP server for programmatic or agent-driven decks. To see how that keeps proposals and forecast reviews aligned with your sources — and to test the refresh and recovery behavior before your next review — book a 30-minute demo.