A sales engineer is halfway through a deal review when the prospect stops asking about specifications and asks a harder question: “Will this fit our site?” The engineer rotates a turbine housing, zooms into a clearance, isolates the internal assembly, and lets the buyer inspect the same geometry from another angle. The conversation shifts from explaining a product to resolving a decision.
That’s where interactive 3D visualization earns its place. It isn’t a decorative layer for a polished demo. Used properly, it’s a decision-support tool that helps buyers understand spatial relationships, test assumptions, and align stakeholders before procurement gets involved. Used badly, it’s a slow, expensive animation that adds spectacle but no commercial value.
The practical question is simple: does the interaction shorten the path to a signed contract?
Table of Contents
- What Interactive 3D Visualization Actually Means
- Why Buyers Engage More With 3D Than Screenshots
- How WebGL and glTF Deliver 3D in the Browser
- Wiring 3D Into Live Data and Presentations
- Design and Performance Rules That Keep 3D Fast
- Choosing the Right Tooling for Web-Native 3D
- Measuring Engagement and Pipeline Impact
- The Smallest 3D Investment That Moves Revenue
What Interactive 3D Visualization Actually Means
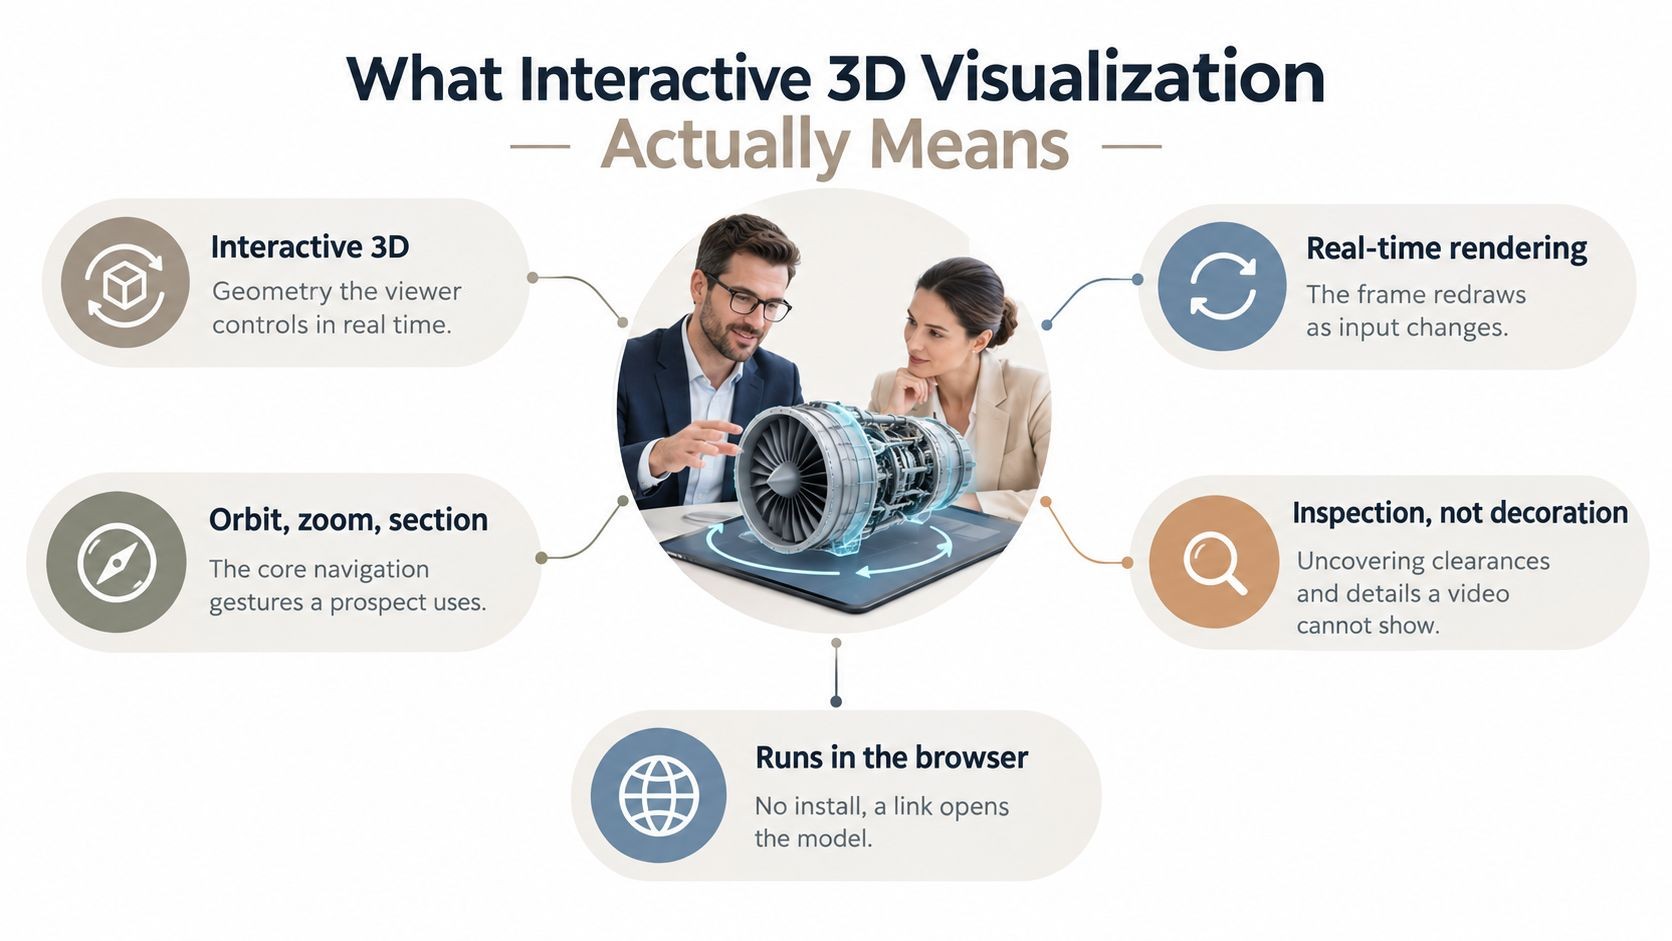
In that turbine review, the model isn’t a video. The buyer controls the view. Geometry, materials, camera position, and selected components respond to input in real time. That makes the asset a runtime-controlled 3D model, not a pre-rendered sequence.
A pre-rendered animation shows the path its creator chose. A screenshot freezes one angle. Interactive 3D gives the prospect control over the questions they haven’t yet asked. They can inspect a housing, check a connection point, or compare a component without waiting for the sales engineer to produce another image.
The three interactions buyers use most are straightforward:
- Orbit: Rotate the product to understand its shape and orientation.
- Zoom: Move from the overall system into a detail that affects fit, access, or maintenance.
- Component isolation: Hide surrounding parts, or cut a section through them, so the buyer can inspect one assembly without visual clutter.
Those gestures matter because they expose spatial truth. A static image can suggest how a product looks. A controlled 3D scene can help a buyer understand how parts relate to one another.
The commercial boundary
This guide is about web-native 3D for sales and marketing, not gaming, engineering simulation, or virtual reality. The model needs enough fidelity to answer commercial questions, but it doesn’t need every bolt if those bolts don’t affect the buying decision.
Practical rule: If a buyer can resolve a meaningful objection by rotating, zooming, or isolating the model, 3D may be justified. If the interaction only makes the asset look impressive, use a simpler visual.
That distinction keeps teams from treating 3D as a design luxury. The right scene supports a decision, such as whether a machine fits a facility, whether a building envelope satisfies a constraint, or whether a product configuration matches a customer’s requirements.
The category’s expansion supports that shift in role. Grand View Research values the 3D visualization segment of the global 3D rendering market at US$1,800.2 million in 2025 and projects US$7,783.3 million by 2033, a projected 20.4% CAGR from 2026 to 2033. The same estimate names North America as the largest revenue-generating region in 2025 and India as the country with the highest expected growth rate over the projection period. The buying lesson is more important than the forecast, though: browser-based interaction is becoming part of how teams present complex products.
Why Buyers Engage More With 3D Than Screenshots
Interactive 3D wins when the buyer needs to explore. Screenshots win when the buyer needs to scan. Video wins when the buyer wants a guided explanation and doesn’t need to control the pace.
That difference is more useful than a generic feature comparison. A revenue team should judge each format by how quickly a stakeholder forms an accurate mental model, how easily objections get answered, and whether several people can leave the meeting with the same understanding.
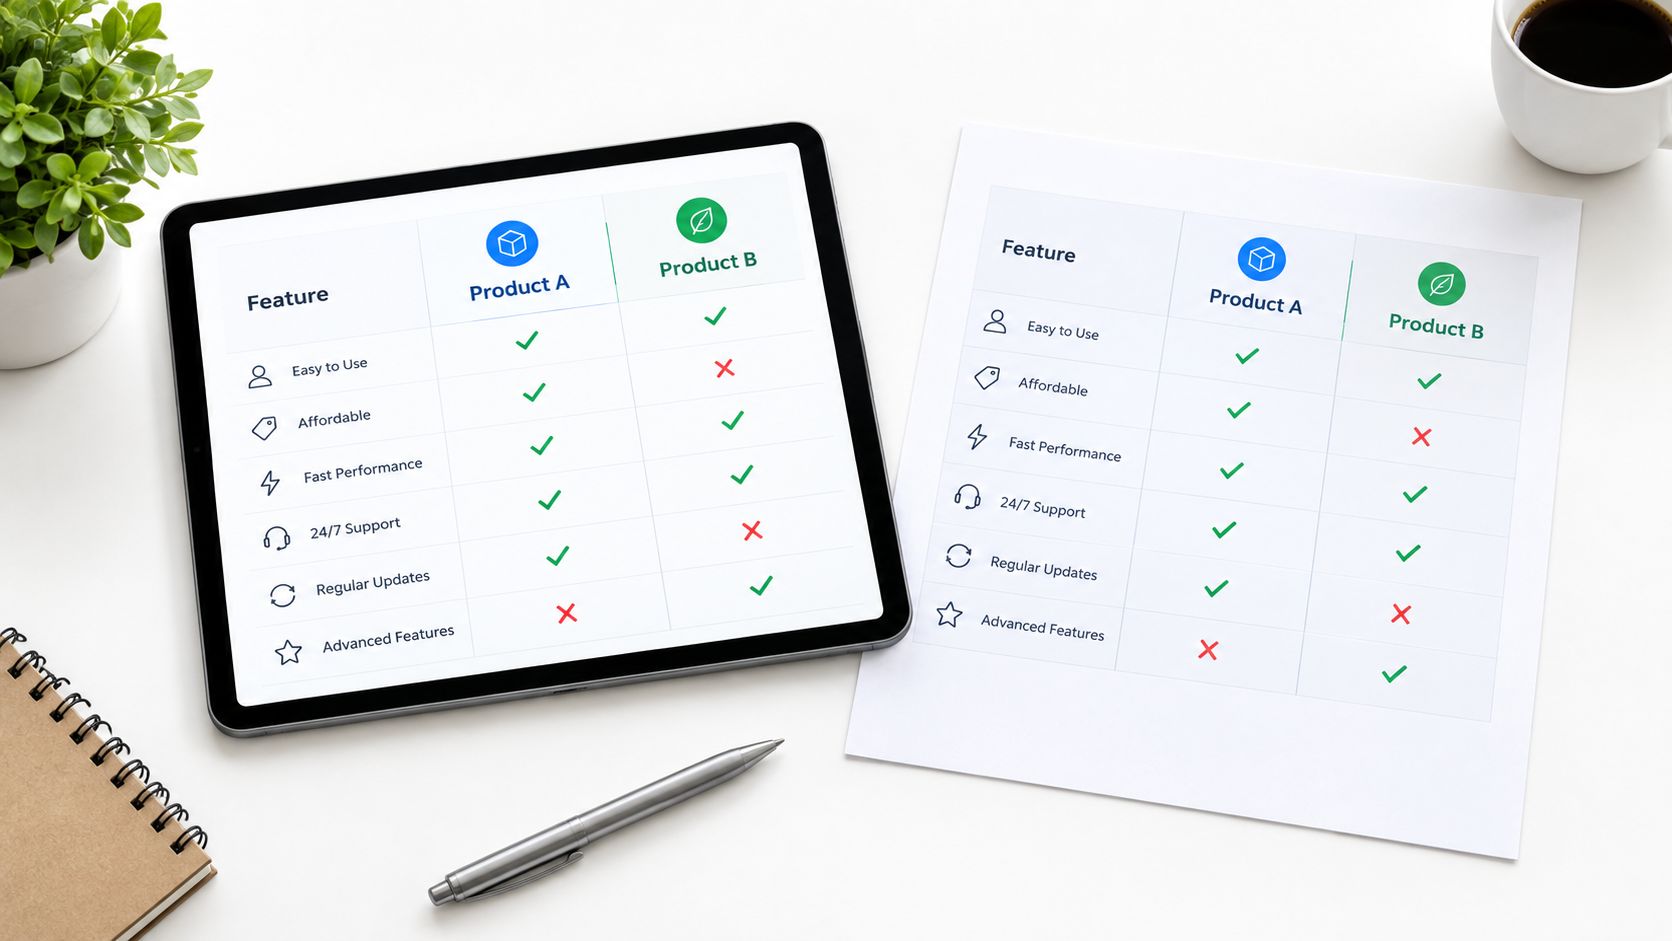
| Criterion | Interactive 3D | Static Screenshots | Recorded Video |
|---|---|---|---|
| Time to first insight | Fast when the key interaction is obvious | Fastest to load and scan | Fast if the relevant moment appears early |
| Recall after the call | Strong for spatial relationships the buyer explored | Limited to the selected viewpoint | Strong for the presenter’s narrative |
| Objection handling | Buyer can inspect the disputed area directly | Requires another asset or explanation | Requires scrubbing or a follow-up |
| Perceived product maturity | Signals an organized, inspectable product experience | Depends heavily on image quality | Depends on production quality and presenter |
| Stakeholder alignment | Multiple people can examine the same model and states | Easy to share, but context can be thin | Consistent narrative, limited exploration |
Why control changes comprehension
Interactive control turns a one-to-many pitch into a one-to-one tour. The prospect can follow their own uncertainty instead of listening to a sequence designed for an average buyer. That self-directed inspection is especially useful when the concern is spatial, such as access, clearance, placement, assembly, or context.
A video remains better for passive listening. A screenshot remains better for a fast-loading proposal, a comparison page, or a simple product with little spatial complexity. The mistake is treating 3D as a universal replacement.
Teams planning a richer product experience can also consult this guide to rich media for product pages, which puts interactive assets in the broader context of product-page content.
The cost of the advantage
3D introduces production and performance work. Someone must prepare the model, define useful states, test interaction behavior, and ensure the browser doesn’t spend the meeting loading an oversized asset. The buyer also needs a clear entry point, otherwise free orbit becomes a blank canvas rather than a guided inspection.
Use 3D when exploration is the source of value. Use screenshots for evidence, video for narrative, and interactive 3D for questions that only become clear when the buyer controls the view.
How WebGL and glTF Deliver 3D in the Browser
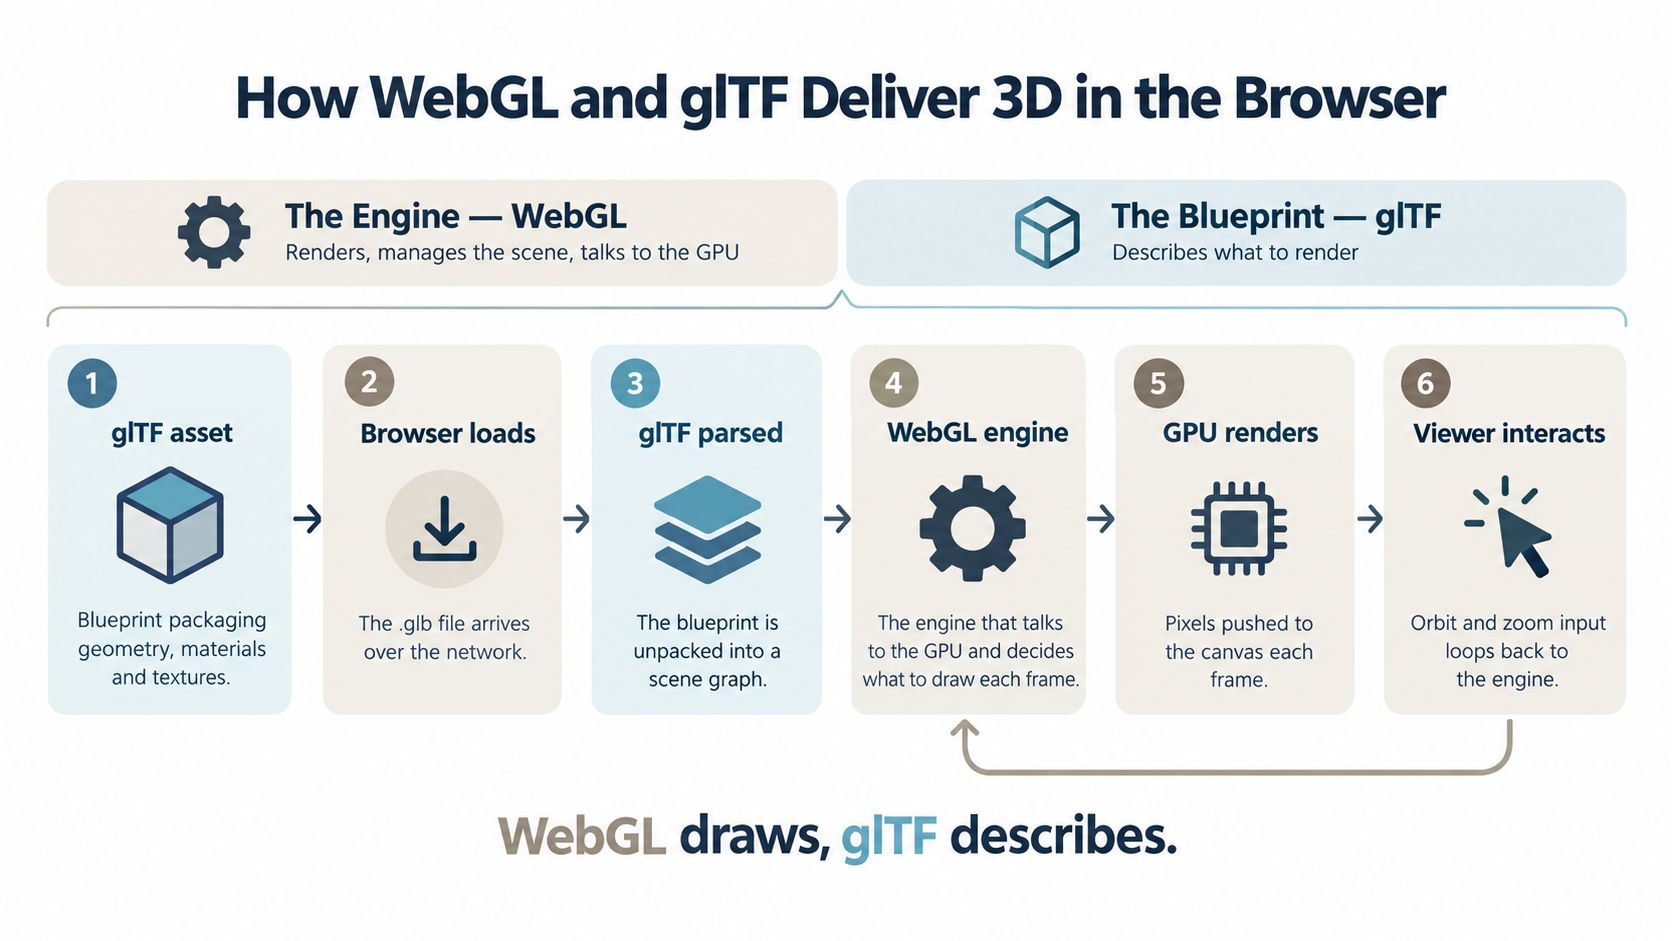
Every buyer-facing 3D experience rests on two technical pillars. WebGL is the engine: the browser’s interface to the GPU, which a runtime such as three.js drives to draw each frame. glTF is the blueprint, packaging the scene’s geometry, materials, hierarchy, and animation in a format the browser can load efficiently.
The analogy is useful because teams often confuse delivery with rendering. A glTF file describes what exists. A runtime reads that description, and WebGL renders it as pixels. The browser needs both. The diagram below folds that runtime into its WebGL engine step.
Follow one model through the stack
A typical asset path looks like this:
- Authoring: A designer builds the model in Blender or a CAD tool.
- Export: The scene is exported to glTF, often with Draco compression for geometry.
- Packaging: The model travels as a
.gltfJSON and asset set, or as a binary.glbpackage. - Delivery: A CDN serves the file to the browser.
- Parsing: A JavaScript runtime such as three.js reads the scene graph, materials, textures, and animations.
- Rendering: The runtime draws the scene through a WebGL-backed canvas.
- Interaction: Orbit and zoom events update the camera, then WebGL redraws the frame.
The Khronos glTF repository describes glTF as a specification for the efficient transmission and loading of 3D scenes and models, and the glTF 2.0 specification calls it a runtime asset delivery format. Its compact JSON structure and optional binary packaging reduce the work required to move a scene from storage into an application. The Library of Congress format description also notes that glTF minimizes both asset size and the runtime processing that 3D applications need.
The format supports more than isolated meshes. It can carry geometry, appearance, scene-graph hierarchy, and animation, with .gltf used for JSON or ASCII files and .glb for binary files, as summarized in this glTF format overview. That makes it suitable for a complete product scene rather than a single decorative object.
Ship the safe stack
WebGL remains the practical rendering layer for revenue tooling because it works in browsers without plugins and provides hardware-accelerated graphics through JavaScript, as explained in this Web3D Consortium overview of WebGL and glTF.
WebGPU is maturing and should eventually expand what browser graphics workloads can do, but MDN still lists it as limited availability because it doesn’t yet work in some widely used browsers. For 2026 shipping decisions, WebGL plus glTF is the dependable baseline. Build the buying experience on the stack your audience can open, not on the stack that looks most promising in a technical roadmap.
Wiring 3D Into Live Data and Presentations
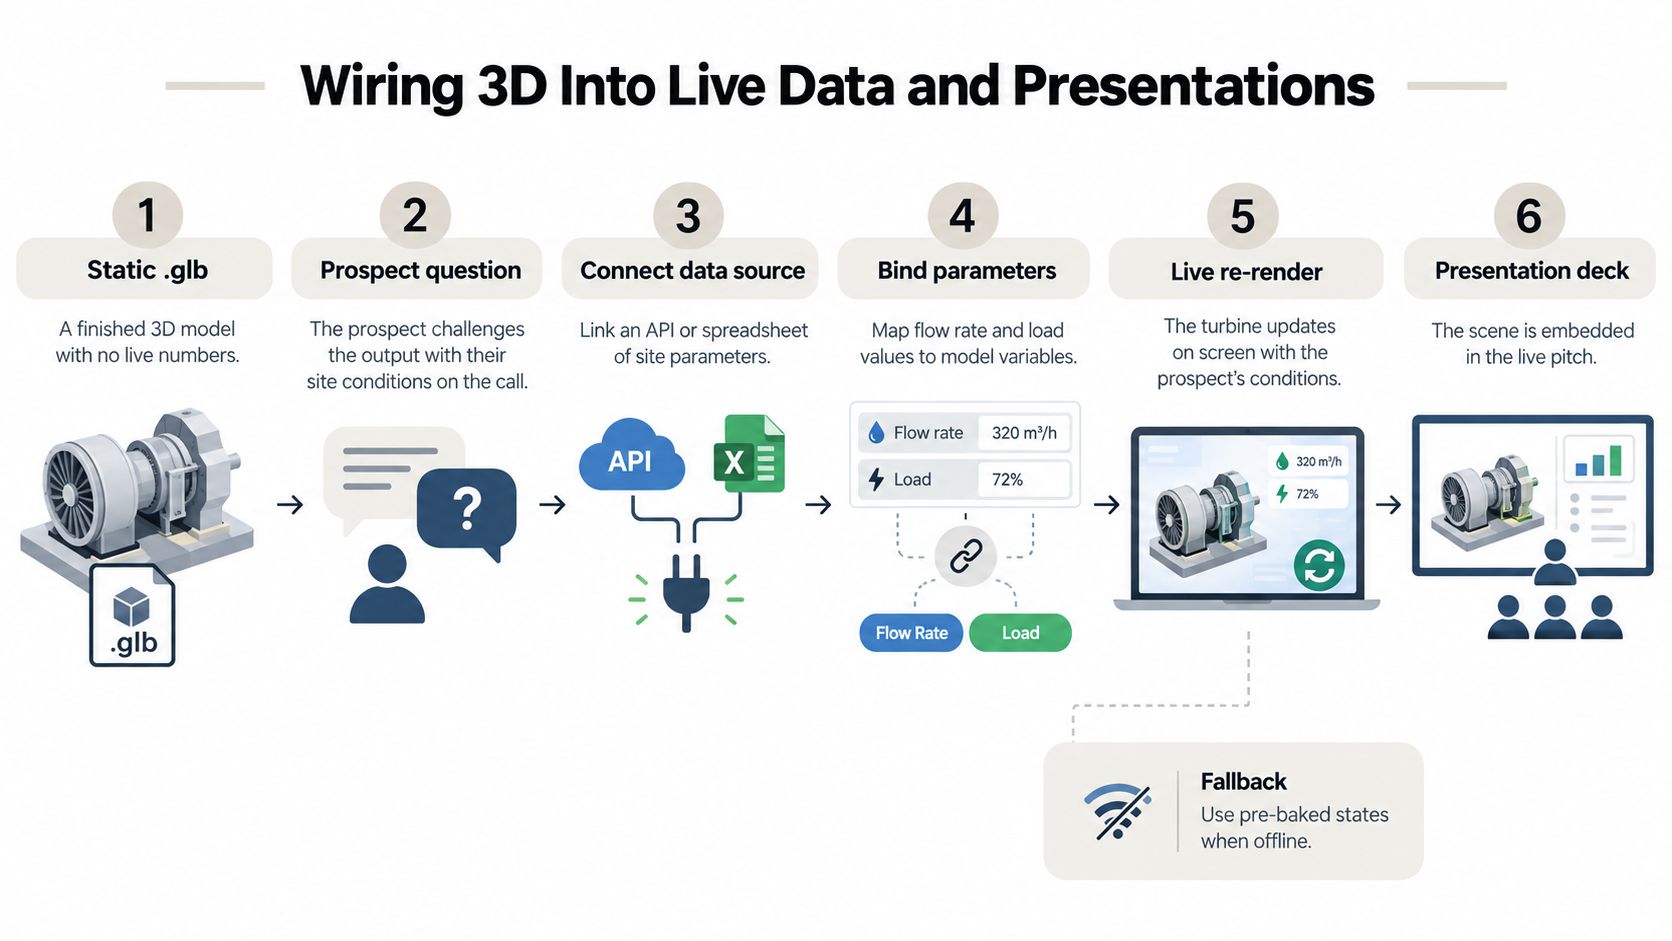
A static .glb becomes commercially useful when the scene reflects the account in front of you. Suppose a prospect asks whether a rendered turbine matches the flow conditions at their site. The account executive shouldn’t need to leave the presentation, open a spreadsheet, and verbally translate the answer.
The better design separates three contracts:
- Asset: The geometry, materials, hierarchy, and interaction targets.
- Data layer: The current state, such as site conditions, selected configuration, or account values.
- Canvas: The browser page, deck, or widget that hosts the scene.
A JSON-driven parameter, REST endpoint, or websocket feed can update a material color, transform a mesh, change a label, or reveal an annotation without rebuilding the underlying geometry. The scene stays stable while the state changes.
Build the sales sequence
Start with a finished model that has no live numbers. Then define the variables that matter to the buyer. A site flow value might change a displayed annotation, while a selected configuration might switch a material state or isolate a component.
The implementation should follow the data, not the visual effect:
- Load the
.glb. - Fetch account or site parameters.
- Validate the values.
- Bind them to named scene objects or UI state.
- Update the model and annotations.
- Record the interaction and the resulting state.
Keep a fallback for weak connections or offline presentation. Pre-baked states are less impressive than live data, but a reliable presentation beats a broken live demo.
Make the deck the host
A 3D viewer can live inside a web-native presentation, a dedicated page, or a presentation platform that supports embedded scenes. A slide can introduce the product, the next state can expose a configuration, and a final view can show the commercial implication. The shareable link matters because the prospect can reopen the same scene after the meeting without downloading a file.
For teams designing the surrounding narrative, this guide on how to make interactive slides offers useful context on structuring presentations around interaction rather than static sequence.
The result is a single sales asset with a stable model, account-aware data, and measurable interaction. That contract is more important than the choice of presentation surface.
Design and Performance Rules That Keep 3D Fast
A beautiful scene that stalls on a prospect’s laptop is a failed sales tool. The engineering target is not visual maximum. It’s fast comprehension with enough fidelity to support the decision.
Use this checklist with the designer and engineer together:
- Control the mesh: Keep a mid-range product model under 100k triangles when that level of detail is sufficient.
- Reduce texture pressure: Use texture atlases and keep textures to 2K maximum where possible.
- Compress geometry: Apply Draco compression during export and test the decode cost on the target browser.
- Use levels of detail: Swap simplified geometry as the camera moves away from the hero object.
- Limit materials: One material per mesh where possible reduces draw calls.
- Load progressively: Lazy-load secondary geometry after the first useful view appears.
- Pause off-screen rendering: Stop the render loop when the canvas isn’t visible.
- Match the display: Throttle rendering to the display refresh rate instead of drawing unnecessary frames.
- Offer a static fallback: Users on weak GPUs should still see a useful frame and the core product message.
- Deliver efficiently: Serve assets through a CDN and compress network responses.
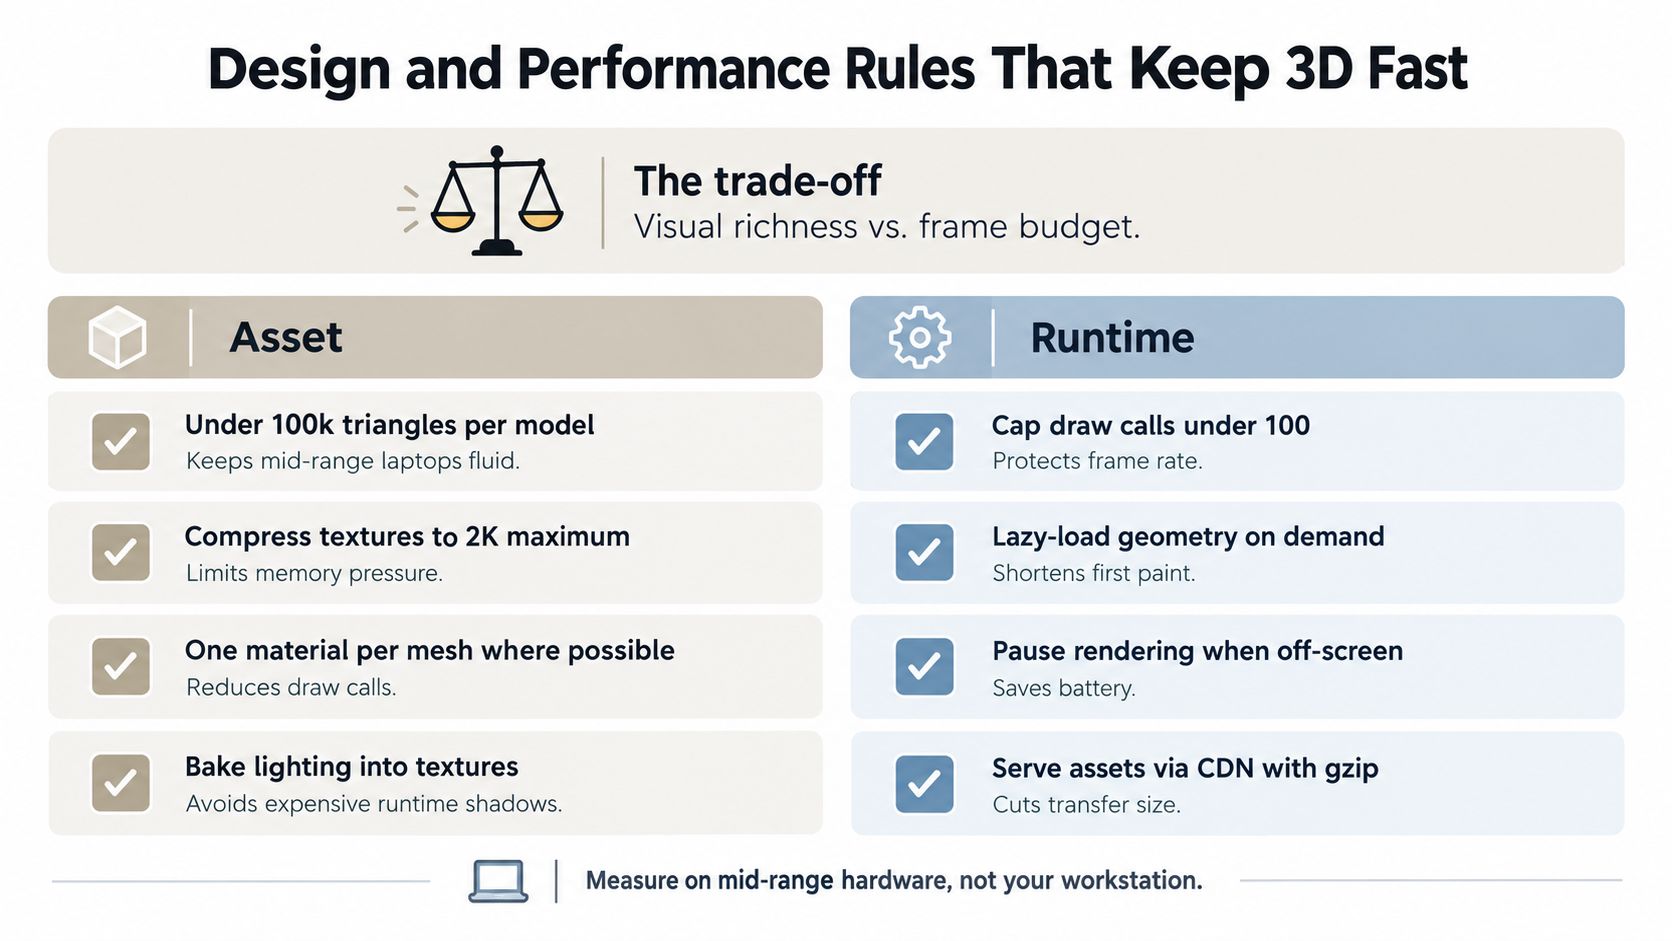
The infographic’s practical benchmark is equally direct: test on mid-range hardware, not the workstation used to create the model.
Design for guided inspection
Don’t place a complex model on a dark gradient and assume the buyer will know what to do. Start with a neutral light setup, one clear hero angle, and hotspots that answer likely questions. A guided camera state can show the important relationship before the viewer takes control.
Performance and design are tied to the same outcome. A first interaction target under 2 seconds and sustained 60 fps on integrated graphics are useful internal goals for a buyer-facing experience, but they must be validated on representative devices rather than assumed from a developer machine.
Engineering judgment: Remove detail before removing responsiveness. Buyers forgive a simplified surface. They don’t forgive a viewer that ignores input.
For broader guidance on presenting quantitative content clearly, see data visualization best practices. The same principle applies here: every visual choice should improve interpretation.
Choosing the Right Tooling for Web-Native 3D
Choose tooling by ownership, not by a feature checklist. The team maintaining the asset will determine whether the project remains useful after launch.
| Team Owner | Recommended Path | Control vs Speed |
|---|---|---|
| Product engineering | Three.js with React bindings | Highest control, more implementation responsibility |
| Technical marketing | model-viewer or a focused three.js viewer | Quick delivery with practical interaction |
| Design team | Spline or Vectary | Faster authoring, less flexibility for complex data binding |
| Revenue operations | Presentation platform with native 3D and analytics | Fastest route to shareable, measurable sales content |
| Developer platform team | Custom WebGL layer with API and state contracts | Maximum extensibility, highest maintenance burden |
Framework route
Three.js is the right choice when the scene needs custom controls, live data hooks, account logic, or unusual interaction. React bindings can make the viewer easier to integrate into an existing product surface. The lightweight model-viewer component is a sensible choice when the requirement is primarily reliable model display, rotation, zoom, and presentation controls.
This path gives engineering the most control over camera behavior, event instrumentation, asset loading, and state management. It also makes engineering responsible for browser testing, performance budgets, accessibility, and future maintenance.
Editor route
Spline and Vectary suit designers who need to create and publish browser-native scenes without writing shaders. They can shorten the path from concept to embed code or React component, but complex CRM synchronization and bespoke runtime behavior may require additional engineering around the scene.
For teams debugging physically based materials, this roundup of online 3D model viewers points to tools that can help isolate whether the issue is the model, texture, lighting, or runtime.
Presentation route
Revenue teams that work primarily in decks should choose a platform that handles the hosting surface, shareable links, permissions, analytics, and live data contract. Encelade, for example, supports browser-based presentations with native .glb and .gltf models that viewers can rotate and zoom, Spline embedding, live connections through Google Sheets and REST APIs for the charts and figures beside the model, and page-level presentation analytics such as views and time on each slide. Live data doesn’t drive the model itself, so a scene whose materials or parts must change with account values still belongs on the framework route. Its relevance depends on whether the team wants the 3D scene to live inside a measurable, link-based sales narrative. Teams comparing the wider category can also review interactive data visualization software.
The decision rule is simple: pick the layer closest to the person who maintains the asset every day. Design should own an editor workflow. Product engineering should own a framework workflow. Revenue teams should avoid turning every sales asset into a custom software project.
Measuring Engagement and Pipeline Impact
Visual polish isn’t proof. A 3D scene deserves continued investment only when buyer behavior indicates that it helps the commercial process.
Track the asset as a sequence of meaningful actions. A view tells you that a page loaded. It doesn’t tell you whether the prospect inspected the area that caused the objection. Record camera interaction, component isolation, configuration changes, hotspot selection, annotation dwell, and return sessions by stakeholder.
| Metric | What It Tracks | Pipeline Relevance |
|---|---|---|
| Time on asset | Whether the group spends meaningful time with the scene | Indicates attention, but needs interaction context |
| Interaction depth | Orbit, isolation, swaps, hotspots, and state changes | Shows whether buyers explored decision-relevant details |
| Repeat sessions | Whether the same stakeholder group returns | Signals continued evaluation or internal sharing |
| Stage progression velocity | Movement after the asset is shared | Connects the experience to deal momentum |
| Multi-stakeholder dwell | Shared attention across the buying group | Stronger than counting one anonymous page view |
Instrument the viewer
Define event names before you build the scene. A useful event payload can include the account, opportunity, stakeholder role, scene identifier, selected component, configuration state, and timestamp. Send those events to the analytics layer, then associate them with the relevant CRM opportunity.
Don’t confuse activity with value. Total page views can rise because one person reloads the page. A smaller number of sessions with deep inspection by several stakeholders may say more about buying intent.
Measure decisions, not decoration. The important event is not that the model rotated. It’s that the buyer used the model to answer a question that affected the deal.
Defend influenced pipeline
Use a treatment cohort of opportunities that receive the interactive asset, a comparable holdout that receives the previous format, and a defined post-share observation window. A 30-day post-share window gives the team a consistent period for reviewing stage movement, stakeholder activity, and opportunity outcomes without claiming that every later deal event came from the viewer.
The report should show which asset was shared, when it was shared, what interactions occurred, and what happened in the opportunity afterward. That evidence lets revenue leaders decide whether to expand, revise, or retire the experience.
The Smallest 3D Investment That Moves Revenue
Don’t start with photorealism. Don’t start with a full configurator. Don’t commission a custom WebGL platform before proving that a specific buying decision needs 3D.
The smallest credible investment is one high-friction asset. It might be a flagship product view, one configuration step, or a campus layout that repeatedly creates confusion in deals. Scope it to one model and one decision, package it as a glTF asset, embed it in an existing presentation surface, and instrument it from the first share.
Run a focused test
A practical test has a narrow question:
- Can buyers understand fit without a second technical meeting?
- Can a prospect compare the relevant configuration without a custom render?
- Can several stakeholders inspect the same spatial constraint after the call?
- Does the asset change the next sales action?
Treat the first 30 days as a learning loop, not a launch celebration. If the target engagement or pipeline signal moves, expand to a second asset and a second deal stage. If it doesn’t, retire the experiment and redirect the budget to narrative, pricing clarity, proof, or a better one-pager.
The market direction is clear, but it doesn’t justify complexity by itself. Grand View Research projects the 3D visualization segment of the 3D rendering market to grow from US$1,800.2 million in 2025 to US$7,783.3 million by 2033, but that projection doesn’t tell you whether your buyer needs a model. Your deal friction does.
Know when to skip it
3D is the wrong call when:
- The product is a low-stakes commodity: A clean comparison table may answer the buyer’s question faster.
- The audience has limited bandwidth: A lightweight image or document may be more dependable.
- The buyer requested a one-pager: Respect the requested format unless the spatial issue is central to the decision.
- The interaction has no commercial consequence: A rotating object without a decision attached is decoration.
- The team can’t maintain the asset: An outdated model creates more confusion than a static visual.
Encelade can help revenue teams combine browser-based presentations, live data, interactive widgets, and native 3D in a shareable sales experience. Visit Encelade to evaluate whether a measured, web-native 3D asset fits your next deal cycle.