Google Sheets
Turn your spreadsheet into a clear story.
Connect your Sheets data to branded charts and statistics. Make reports and account reviews easier to follow.
Requires a configured Google Sheets connection and permission to access the selected spreadsheet. Proposal creation is available on Pro and above. Compare plans
Read the transcript
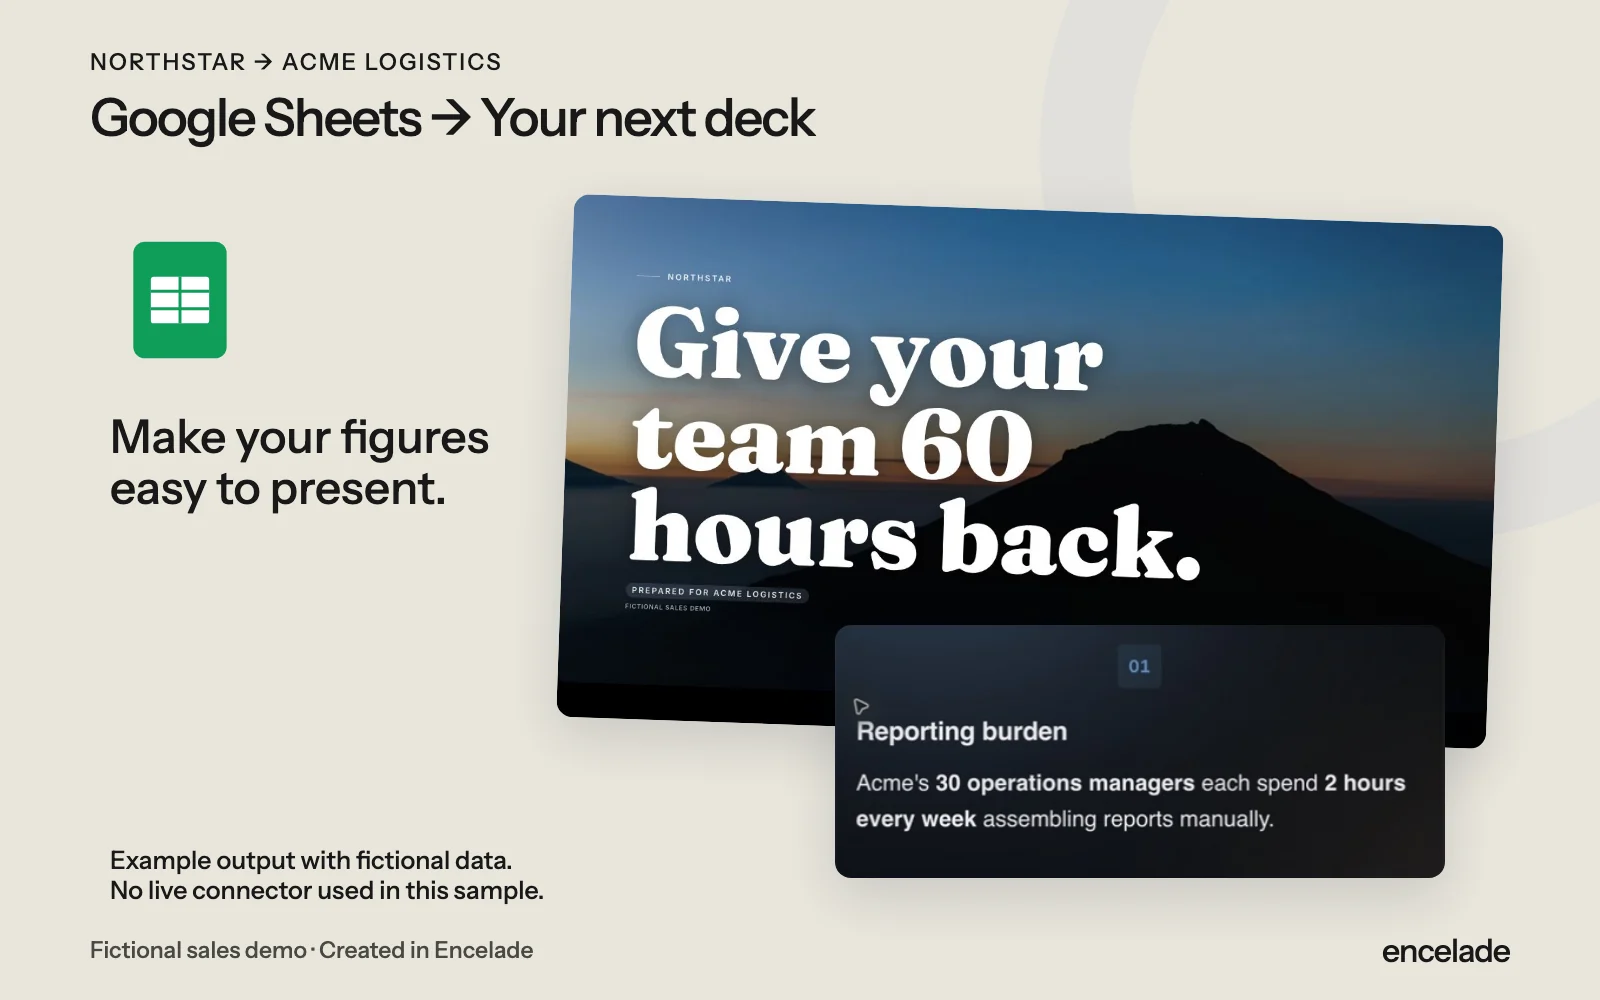
The Google Sheets integration, paired with a real Northstar presentation created in Encelade. Northstar and Acme Logistics are fictional demo companies. This sample illustrates the output; no live connector was used.
How it works
Three steps to get started.
- 01
Choose a spreadsheet
Connect Google Sheets and select a spreadsheet you can access.
- 02
Add a chart or statistic
Use a range for a chart or a cell for a statistic.
- 03
Refresh before sharing
Fetch updated values and check the results before your next conversation.
- Charts from spreadsheet ranges
- Statistics from individual cells
- Connected data refresh
- Branded reports and account reviews
Your questions, answered.
Does the deck always show the latest data?
Use the refresh controls when you need updated figures. Connected data can be cached.
Can viewers edit my spreadsheet?
No. Viewing the deck does not grant access to the source spreadsheet.
How is this different from an ROI calculator?
Sheets supplies data to charts and statistics. An ROI calculator lets buyers change the inputs you define inside the deck.