If you've ever opened a sales deck five minutes before a meeting and found the numbers were already stale, you know the problem. The spreadsheet looked fine, the chart looked polished, and the client still saw yesterday's reality. Google Sheets live data promises to fix that, but in practice there's a big difference between a sheet that updates on a schedule, a sheet that refreshes when someone pokes it, and a sheet that behaves like a live system.
Google made this category real when Connected Sheets became generally available on June 30, 2020, giving users a direct connection between Sheets and BigQuery so they could work with billions of rows and petabytes of data inside a familiar spreadsheet interface instead of jumping into SQL for every analysis, with rollout initially focused on enterprise customers (Google Workspace announcement). That matters because teams still talk about "live data" as if it means instant propagation. It usually doesn't.
Table of Contents
- What Google Sheets Live Data Actually Means in 2026
- Three Core Methods to Stream Google Sheets Live Data
- Authenticating the Sheets API the Right Way
- Embedding Live Sheets Data Into Presentations
- Keeping Numbers Fresh With Scheduled Refresh and Webhooks
- Common Pitfalls and How to Troubleshoot Them
- A Practical Checklist Before You Ship Live Sheets Data
What Google Sheets Live Data Actually Means in 2026
Most teams use "live" to describe three very different behaviors. First, there's a sheet that pulls data from another system on a schedule. Second, there's a sheet that refreshes when a user opens it, recalculates, or triggers a connector. Third, there's a workflow where edits flow both ways and automation reacts without anyone prompting it. Those are not the same thing, and treating them as the same is how dashboards go stale in front of customers.
Snapshot-based is the default mental model
For Connected Sheets, Google's docs make the key point plain: refresh is not automatic by default. BigQuery data doesn't sync on its own — users have to refresh a specific item, an entire data source, or all data sources, and they can also schedule refreshes at a preset time (Google support on refresh behavior). That means the sheet is acting more like a controlled snapshot than a constantly mutating database window.
Practical rule: if a stakeholder can make a decision from the output, define how fresh that output needs to be before you choose the connector.
The older connective tissue also matters historically. Google set a hard cutover: after June 30, 2022, sheets that used the traditional data connector had to be upgraded to Connected Sheets, which shows the move from ad hoc spreadsheet integrations toward a standard live-data model (Google help documentation). If you're inheriting an old workbook, assume some formulas, connectors, and expectations were built around a different refresh model.
"Live" often means "fresh enough"
That distinction matters most in revenue work. A forecast tab, a client-facing KPI page, or a slide embedded in a live demo does not need philosophical real-time behavior. It needs the right freshness contract. Google Sheets import functions like IMPORTDATA, IMPORTHTML, and IMPORTXML check for updates every hour while the document is open, and reopening the file doesn't force a refresh (Google support on import refresh timing). That's fine for reference data, but it's not enough for a time-sensitive board deck.
The decision point is simple. If your audience cares about precision at a given moment, you need a controlled refresh path, a visible staleness indicator, and a fallback when the sheet can't refresh in time. If they just need a working analytical view, snapshot-based live data is often enough.
Three Core Methods to Stream Google Sheets Live Data
The first mistake teams make is picking tooling before they pick behavior. Google Sheets live data usually moves through one of three paths, each with very different latency and failure modes. Choose the wrong one, and you'll spend your time debugging stale visuals instead of presenting numbers.
| Method | Latency | Best for |
|---|---|---|
| Connected Sheets refreshes | Snapshot-based, scheduled or manual | BigQuery and Looker analysis inside Sheets |
| API-driven reads and writes | Near-real-time from the app's view, but quota-limited | Custom dashboards, presentation pipelines, automation |
| Import formulas and published exports | Interval-based, not event-driven | Lightweight public views and simple reference panels |
Connected Sheets for analysis inside the spreadsheet
Use Connected Sheets when analysts need to stay in the grid, build pivot tables, and avoid SQL-heavy workflows. Google's own description is explicit: users can access, analyze, visualize, and share billions of rows of BigQuery or Looker data directly from a spreadsheet (Google support on Connected Sheets). That makes it strong for exploration and reporting, not for event-driven dashboards that must reflect every tiny edit.
Sheets API for controlled application logic
If you're building a deck pipeline or an internal dashboard, the Sheets API gives you the most control. You decide what to read, when to read it, and which ranges matter. That's the right model for presentation embeds, but it comes with operational discipline. The API quotas are tight enough that sloppy polling will fail fast, especially in multi-user environments (Sheets API limits).
Import formulas and published outputs for simple feeds
Import functions are useful when the source is simple and the audience tolerates delay. They're not event-driven, and they won't behave like a webhook. If the data source changes, the spreadsheet only checks on its own schedule, which is why these formulas are good for reference views and weak for client-facing operational dashboards.
A useful way to think about it is this. Connected Sheets is for analysis. API workflows are for orchestration. Import formulas are for convenience. If you need a deck that pulls current numbers on render, the API path is usually the one that survives production.
Authenticating the Sheets API the Right Way
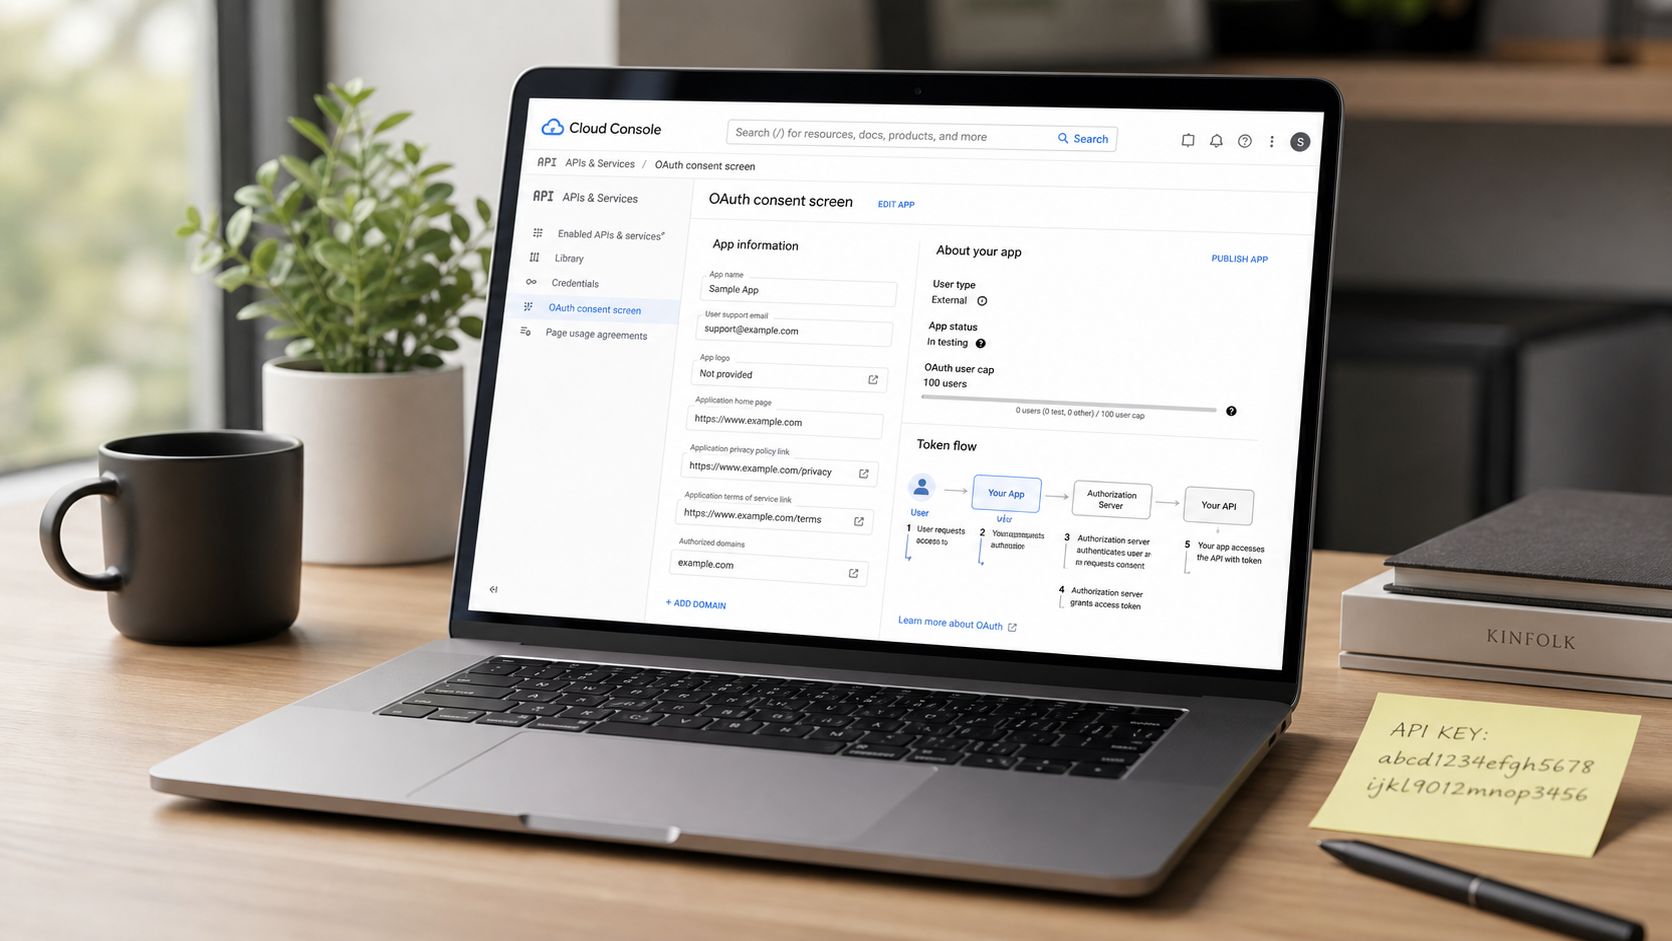
Start with identity, not code. If the service account or user token isn't set up correctly, every downstream refresh problem looks like a data bug when it's really an auth bug. The practical setup is boring but exact: create the project, enable the Sheets API, choose the token flow that matches your deployment, and share the spreadsheet with the identity that will read it.
For automation against Google Sheets live data, the token flow usually comes from a service account in server-side jobs, or OAuth if a human user is authorizing a connected workflow. The important thing is to separate read access from edit access. A lot of systems only need read scopes for presentation rendering, while refresh automation or trigger management needs broader permission.
The quota limits you hit first
The Sheets API enforces 300 read requests per minute per project and 60 per minute per user per project (Google API limits). If you're polling each slide component independently, you'll burn through those numbers faster than you expect. Batch reads are the safer default, and a single batchGet call is usually better than a spray of individual values.get requests.
That's also where many teams underestimate latency. The API can respond quickly, but your refresh logic still needs to respect the workbook's actual update cadence. If you're pulling data every few seconds from a source that only changes every few minutes, all you're doing is increasing load and triggering quota pressure.
Setup that actually holds up in production
The clean pattern is straightforward. Use a dedicated service account, share the sheet with that account, restrict scopes to what the job needs, and keep the read ranges stable. If you're wiring the sheet into a broader presentation system, a focused integration pattern like the one described in this REST API integration guide is easier to maintain than a one-off script hidden in a spreadsheet.
Don't bind your deck pipeline to a human user's token unless you enjoy emergency reauth at the worst possible time.
The goal isn't to make Sheets "more real-time." It's to make authentication predictable so refresh logic can fail loudly and recover cleanly.
Embedding Live Sheets Data Into Presentations
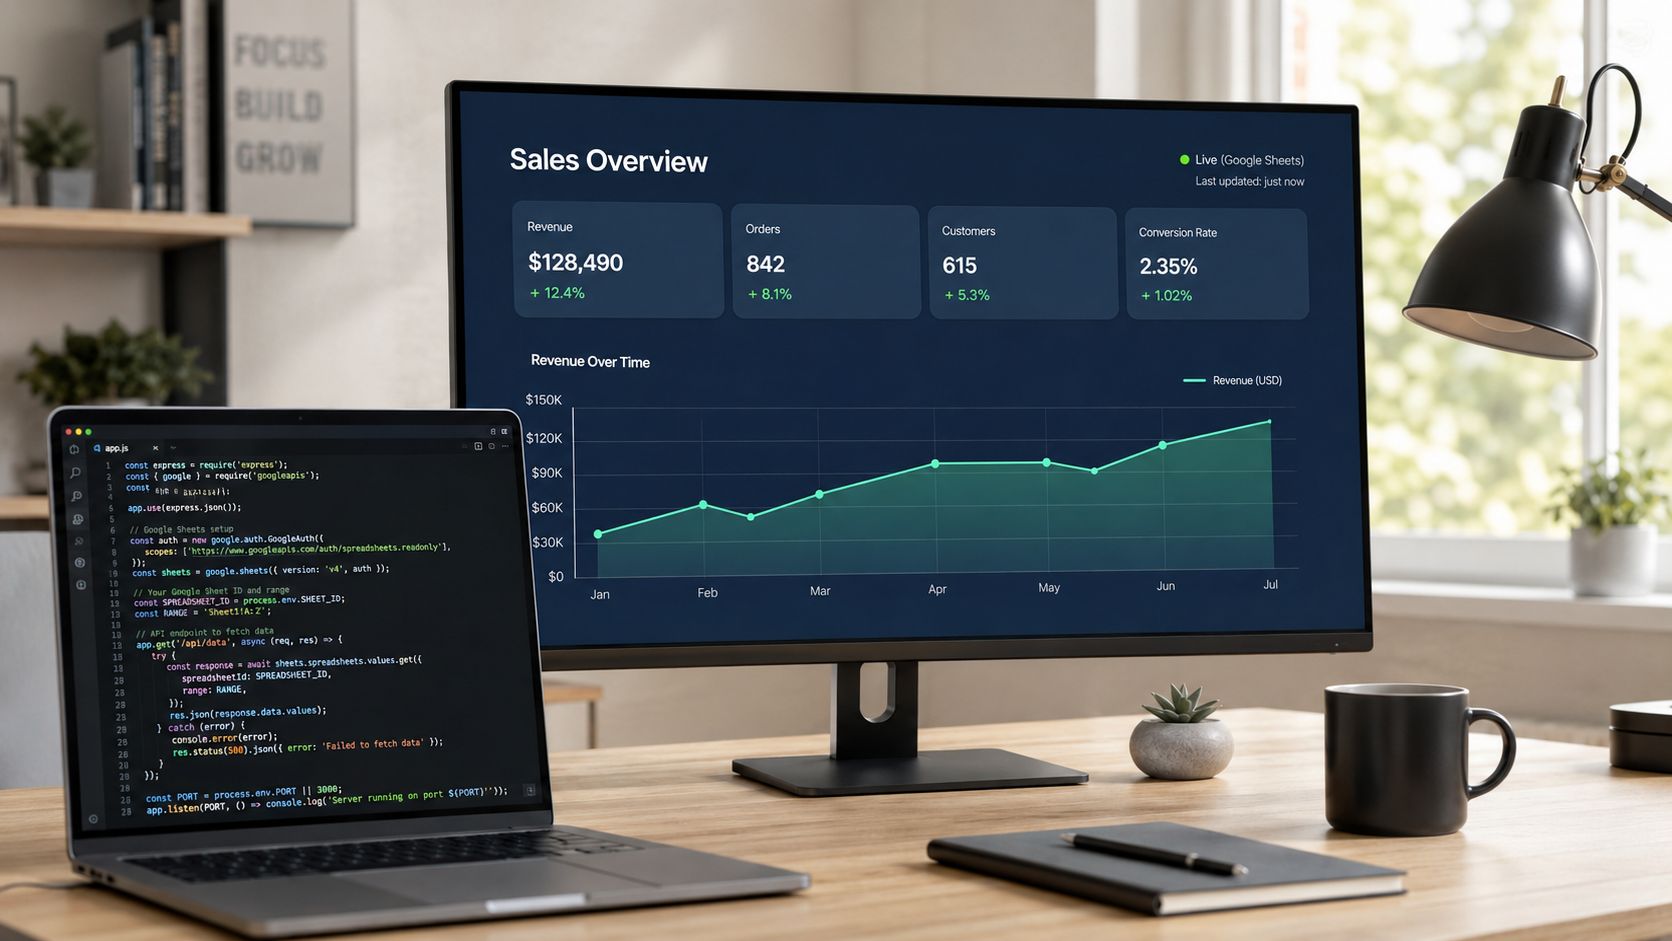
For decks, the question is not whether Sheets can show current data. It's how that data gets into a slide without turning every presentation into a manual export ritual. The most reliable pattern is to expose a narrow JSON endpoint from Sheets data, then let the deck render from that endpoint each time it opens or refreshes.
Start with a sheet range that represents the dashboard surface, then read it through the API and transform it into a small payload. A minimal Node example looks like this.
const { google } = require('googleapis');

async function readDashboard(auth) {
  const sheets = google.sheets({ version: 'v4', auth });
  const res = await sheets.spreadsheets.values.get({
    spreadsheetId: process.env.SPREADSHEET_ID,
    range: 'Dashboard!A1:D20',
  });

  return {
    // Fetch time, not source freshness: the sheet may return an older
    // Connected Sheets / import-formula snapshot. Surface the source's own
    // refresh time separately if you need a true staleness indicator.
    fetchedAt: new Date().toISOString(),
    values: res.data.values || [],
  };
}
That payload can back a web-native deck, a chart widget, or an embedded panel. If you're publishing a read-only sheet view for a simple iframe, the standard URL format is the published sheet endpoint with widget=true, headers=false, and gid= for the target tab. For a cleaner surface, chrome=false drops the title bar and the footer strip — including the "Made with Google Sheets" banner — that people don't want in a client-facing view.
The published-to-web route is useful, but it's not instant. Assume it caches and can lag by a few minutes, and design your deck copy accordingly.
A simple embed can auto-refresh on a timer when you need a browser-native experience. Reload only the iframe, not the whole page — a top-level meta refresh would reset the surrounding deck's active slide and presenter state every interval.
<iframe
  id="sheet"
  src="https://docs.google.com/spreadsheets/d/SHEET_ID/pubhtml?widget=true&headers=false&chrome=false&gid=0&single=true"
  width="100%"
  height="600"
  style="border:0;">
</iframe>
<script>
  // Refresh only the embed, so the surrounding deck keeps its state.
  setInterval(() => {
    const frame = document.getElementById('sheet');
    frame.src = frame.src;
  }, 30000);
</script>
For slide systems that can pull JSON, point the chart object at the endpoint that serves the transformed Dashboard!A1:D20 output, then let the slide renderer hydrate the numbers on load. That keeps the presentation logic separate from the spreadsheet logic, which is the only way this stays debuggable over time.
If you're building interactive decks, the mechanics are even more useful in tools that support live widgets and editable presentation layers, which is the kind of workflow covered in this interactive slides guide. The point is the same either way: the deck should read from a stable data contract, not from someone's exported screenshot.
Keeping Numbers Fresh With Scheduled Refresh and Webhooks
A revops team that runs this well does not bet everything on one refresh path. They run a scheduled poll for the aggregate dashboard, then use row-level events for the changes that matter in the middle of the day. That split keeps the sheet useful when someone wants a broad trend, and still responsive when an individual opportunity changes state.
What fires when
The scheduled layer handles the slow-moving truth. A Cloud Scheduler job invokes a small worker — a Cloud Run service or Cloud Function — on a cadence that fits the reporting rhythm; the worker calls values.batchGet and writes the results into the deck-facing cache. Point Scheduler at that worker, not straight at the Sheets API: Scheduler only fires the request and records the outcome, so a direct call could return current data while nothing updates the cache. That catches aggregate shifts and makes sure the presentation has a consistent baseline.
The faster layer is the trigger path. An Apps Script onEdit trigger pushes a row-level event to a Cloud Run endpoint, which then persists the change and updates downstream consumers. In practice, that gives the team a much faster reaction for the specific row someone just touched. A nightly time-driven Apps Script trigger then reconciles any drift and catches anything the event path missed.
Operational insight: don't expect a single trigger type to handle both presentation freshness and audit consistency. Split them.
Where the system breaks first
The first hard ceiling is quota. Google documents 300 read requests per minute per project and 60 per minute per user per project for the Sheets API, so frequent polling and many viewers can collide quickly (Sheets API limits). The second issue is the write side, where the same 60 per minute per user per project ceiling on writes becomes a bottleneck if the workflow writes back too aggressively.
If you're wiring this through Apps Script, keep the payload small and the intent explicit. An installable trigger posts event details, then the receiving service validates the request before persisting it. For the revops team, that's enough to keep the dashboard current without pretending the sheet is a message bus.
The same architecture works better when you keep the sync story honest. A newer live-data model can feel app-like, but the older Sheets guidance still matters because many workflows are still snapshot-first under the hood, which is why this real-time sync article is worth reading alongside the Sheets docs. The difference between "updated by schedule" and "updated by event" is the difference between a clean Monday morning report and a frantic call before a demo.
Common Pitfalls and How to Troubleshoot Them
Live-data failures in Sheets are usually not dramatic. They're small misalignments between what the team assumes and what the connector actually does. The fastest way to debug them is to separate freshness, quota, trigger, and sharing problems.
| Pitfall | Root cause | Fix |
|---|---|---|
| Stale embedded charts | Published exports are cached and can lag several minutes | Set a stricter refresh expectation and avoid promising instant updates |
| 429 errors | Too many concurrent reads against the API | Add exponential backoff with jitter and consolidate into batchGet |
| Broken edit triggers | Scope or authorization changes invalidated the Apps Script install | Reinstall the trigger with the right permissions |
| Date drift | Script timezone and spreadsheet timezone don't match | Align both timezones before aggregating dates |
| Private tabs exposed | Full sheet was published instead of a sanitized view | Publish only a sanitized sheet, or copy the safe data to a separate workbook — a named range filters the view, not access |
| Iframe blocking in PowerPoint | Mixed-content or non-HTTPS embedding | Serve embeds over HTTPS only |
Read freshness from the system, not the label
The published-to-web path can look live while still being delayed. That's why the "real-time" label on a dashboard doesn't tell you much unless you know the caching model behind it. If a client needs a near-instant visual, use the API path with a controlled refresh instead of assuming a published sheet will update immediately.
Make permission problems boring
The most annoying failures are usually the simplest. If an onEdit trigger stops firing after someone changes auth scopes, the fix is often to reinstall the script or reauthorize the add-on flow. If an iframe doesn't render in a deck, check whether the embed is being blocked because the endpoint isn't served over HTTPS.
Respect workbook limits early
Google enforces a hard workbook-wide ceiling of 10,000,000 total cells across all tabs, and exceeding it can produce a #NUM! error when you extract large datasets (Google admin guidance). That's not just a storage issue. It shapes how much data you can safely expose to a live dashboard before the workbook itself becomes the bottleneck.
The best troubleshooting habit is to log the last refresh time in the sheet and show it in the deck. Once viewers can see staleness directly, you stop arguing about whether the number is wrong and start fixing the actual sync path.
A Practical Checklist Before You Ship Live Sheets Data
Ship the workflow in the order production will break it. First, confirm the service account has the right Sheets scope — read-only is enough to render a shared sheet, and a Drive scope is only needed if the job also lists or inspects files through the Drive API — then verify the spreadsheet is shared with that account. If the identity can't open the file, nothing else matters.
Next, test the exact read endpoint against the exact range the slide uses. A deck that points at Dashboard!A1:D20 should be validated against that range, not against a nearby scratch tab. After that, decide whether the business needs polling, push notifications, or both, and document the refresh cadence in plain language so nobody assumes every edit is instant.
Pre-launch checks that save the on-call engineer
- Quota headroom: Track the 300 read requests per minute per project and 60 per minute per user per project limits before launch, then add alerts for
429responses. - Embed safety: Keep all embeds on HTTPS, and test them in the exact deck platform you'll use.
- Freshness signal: Add a visible cell that shows the last sync time so viewers can spot stale data immediately.
- Fallback behavior: Decide what the deck shows when refresh fails — cached values, a warning state, or a blank chart.
- Ownership: The on-call engineer owns auth and quota, the data owner owns the sheet structure, and the deck author owns the rendered presentation.
Lock down permissions, pick the refresh path that matches the business tolerance for staleness, and rehearse the failure mode once before anyone important sees it.
Encelade connects live spreadsheet data to interactive, web-native decks, so a Sheets-backed dashboard reaches a client without turning every update into manual slide surgery. To see how its live data connections fit into a Sheets-backed workflow — book a 30-minute demo.