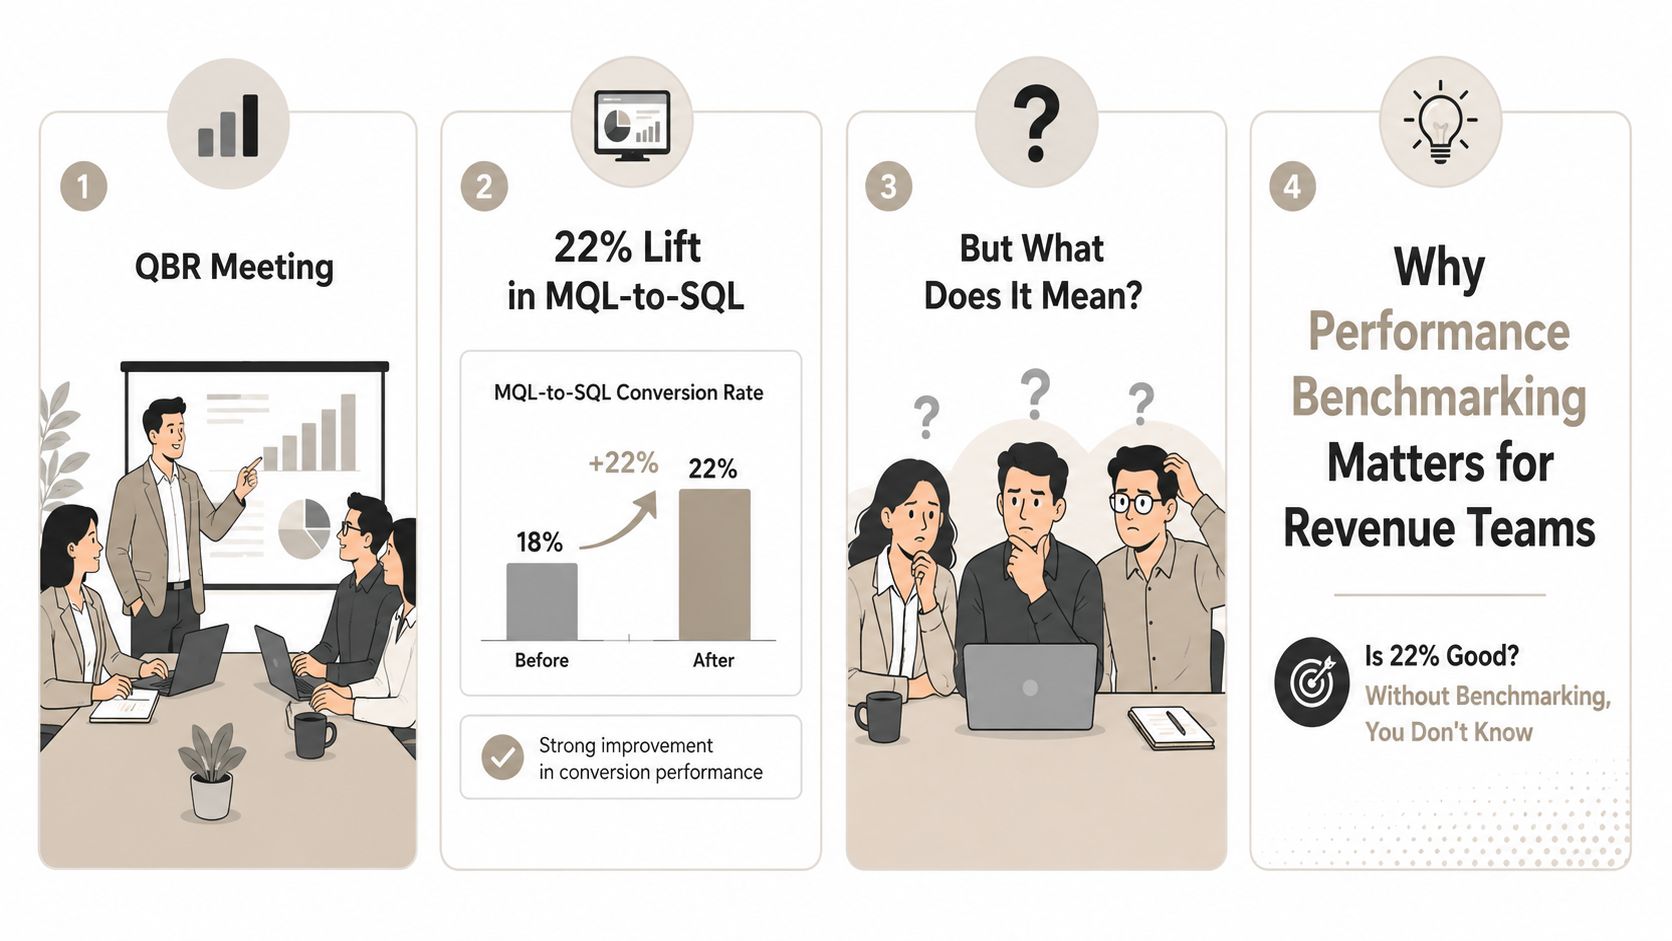
You're in a quarterly business review. The VP of Sales points to a dashboard showing a 22% lift in MQL-to-SQL conversion, then asks the question nobody can answer: is 22% good, bad, or meaningless?
The problem isn't the dashboard. It's the missing reference point. Without a comparable cohort, historical baseline, or explicit target, the number can support almost any story. Performance benchmarking gives revenue teams a shared way to decide whether a result deserves investment, investigation, or no action at all.
Table of Contents
- Why Performance Benchmarking Matters for Revenue Teams
- Defining Goals and KPIs That Actually Move Revenue
- Setting Baselines and Designing Tests You Can Trust
- Collecting and Visualizing Data Without Hiding the Truth
- Turning Results Into Interactive Presentations and Revenue Workflows
- Iterating Without Letting Benchmarks Go Stale
- Your One-Page Benchmark Action Checklist
Why Performance Benchmarking Matters for Revenue Teams
A conversion rate can rise after lead quality improves, fewer borderline leads are accepted, or a reporting filter changes. Each cause calls for a different response. Treating the visible movement as progress before checking its context turns a dashboard into a source of bad decisions.
Marketing may request more budget because conversion improved. Sales may ask for headcount because pipeline appears healthier. Rev ops may revise the forecast using a metric that has never been calibrated against a stable reference. Internal data without context becomes scorekeeping, while a decision-grade benchmark connects movement to a specific action.
Shared truth beats competing dashboards
Benchmarking gives a metric a comparable reference:
- Historical cohorts, such as the same segment and sales motion in prior periods.
- Peer groups, such as enterprise opportunities handled by similar account executives.
- Explicit targets, such as a service threshold or revenue-plan assumption.
- Distribution ranges, which reveal whether the median hides a problematic tail.
The practice predates modern revenue operations. Formal performance benchmarking emerged in the computer industry in the late 1980s. SPEC was founded on November 14, 1988, and released its first benchmark suite in 1989, using standardized workloads instead of ad hoc comparisons. By 1992, SPEC had expanded to SPEC CPU92 with 20 benchmark programs. The change showed why broader workload representation is more useful than one summary number, as documented in SPEC's benchmarking timeline.
Management teams later applied the same logic to business processes. A Statistics Canada paper on benchmarking describes benchmarking as identifying, sharing, and using knowledge and best practices to improve a process. For revenue leaders, the output is not a static report. It is a clearer choice about where people, budget, and operating attention should go.
A revenue operations platform can centralize definitions, ownership, and reporting context, but the team still owns the discipline. Review benchmark trends as conditions change, then turn the current view into an interactive presentation that stakeholders can inspect and share. The benchmark should answer one practical question: what decision changes because this result moved?
Defining Goals and KPIs That Actually Move Revenue
KPI selection works best as a funnel, not a catalogue. Start with the revenue outcome, then work backward to indicators a team can influence and review frequently enough to change behavior.
A practical sequence looks like this:
- Name the outcome. Choose the business result under review, such as new ARR, expansion ARR, or net retention.
- Identify the operating levers. Connect the outcome to pipeline velocity, opportunity win rate, average sales cycle, demo-to-close ratio, content-influenced pipeline, or campaign-attributed ARR.
- Assign ownership. A sales leader might own win rate by segment. A marketing leader might own cost per qualified opportunity by channel.
- Define the action. State what the team will do if the KPI falls below, reaches, or exceeds its benchmark.
Use this sentence to force precision: "We benchmark [KPI] against [peer or time cohort] to decide [specific action]." If the sentence feels vague, the metric probably isn't ready.
A revenue-tiered KPI template
| Revenue Outcome | Leading Indicator | Sales Example | Marketing Example | Decision It Drives |
|---|---|---|---|---|
| New ARR | Pipeline velocity | Velocity by segment and owner | Qualified opportunity creation by channel | Reallocate coverage or campaign effort |
| Expansion ARR | Opportunity win rate | Win rate for existing accounts | Expansion content-influenced pipeline | Prioritize account plays |
| Net retention | Sales cycle and renewal movement | Cycle length by deal type | Cost per qualified opportunity for expansion campaigns | Escalate risks or adjust customer programs |
| New-logo growth | Demo-to-close ratio | Ratio by AE and segment | Campaign-attributed opportunity quality | Change qualification, enablement, or channel mix |
A metric earns a place in the benchmark only when someone owns it, the team can measure it on a recurring basis, and the result can actually change behavior inside the operating window. A quarterly revenue outcome may be the destination, but weekly leading indicators tell managers whether the route is still viable.
Practical rule: If nobody can name the action attached to a KPI, remove it from the decision dashboard.
Three to five well-chosen KPIs usually create a stronger management conversation than a dashboard containing forty. More metrics can create the appearance of control while making it harder to identify the signal that deserves intervention.
Setting Baselines and Designing Tests You Can Trust
A baseline earns trust before the test starts. Fix the comparison first, then collect results. Otherwise, a favorable slice of data can become the new definition of success.
Four controls for a credible baseline
Lock the window and cohort. Define the period, segment, and sales motion before collecting results. A useful revenue baseline might cover the last 6 closed quarters, limited to the same customer segment and motion. This keeps a shift from mid-market to enterprise, or from new-logo sales to expansion, from appearing to be a performance change.
Preserve environment parity. Keep sales tools, source systems, qualification definitions, filters, and ownership rules comparable. A widely cited "benchmarking crimes" guide catalogs how mismatched workloads, hardware, or test conditions distort comparisons. In revenue operations, the equivalent error is comparing opportunities classified under different qualification rules.
Write the hypothesis before the test. State the single variable being changed, the test duration, and the metric that determines success. If the team introduces a new discovery script, leave the territory model, pricing process, and enablement package unchanged. Changing several inputs at once makes a positive result difficult to attribute and a negative result difficult to fix.
Check stability before declaring victory. Across repeated benchmark runs, calculate the mean and standard deviation, then watch how much the result moves from run to run. That same benchmarking-crimes guidance treats quoting the standard deviation as essential and warns that a standard deviation above roughly 1% should raise suspicion. Revenue metrics run noisier than lab benchmarks, so set a pragmatic guardrail rather than a lab-grade one: investigate a coefficient of variation above 5% as a possible sign of instability, and if week-over-week CV exceeds roughly 10%, extend the run or increase the sample instead of publishing a confident conclusion.
A worked sales example
Suppose rev ops is comparing median sales cycle performance with top-quartile account executives after introducing a discovery script. The baseline uses a fixed cohort and the existing script. The hypothesis is that the new script will improve cycle performance without reducing win quality. Exit criteria include a stable median comparison, unchanged qualification rules, and no deterioration in related conversion metrics.
The initial result shows movement, but the CV check exceeds the 10% internal guardrail. The team extends the test by two weeks rather than presenting the early result as finished. That choice slows the readout, but it protects the forecast review from a number shaped by short-term noise.
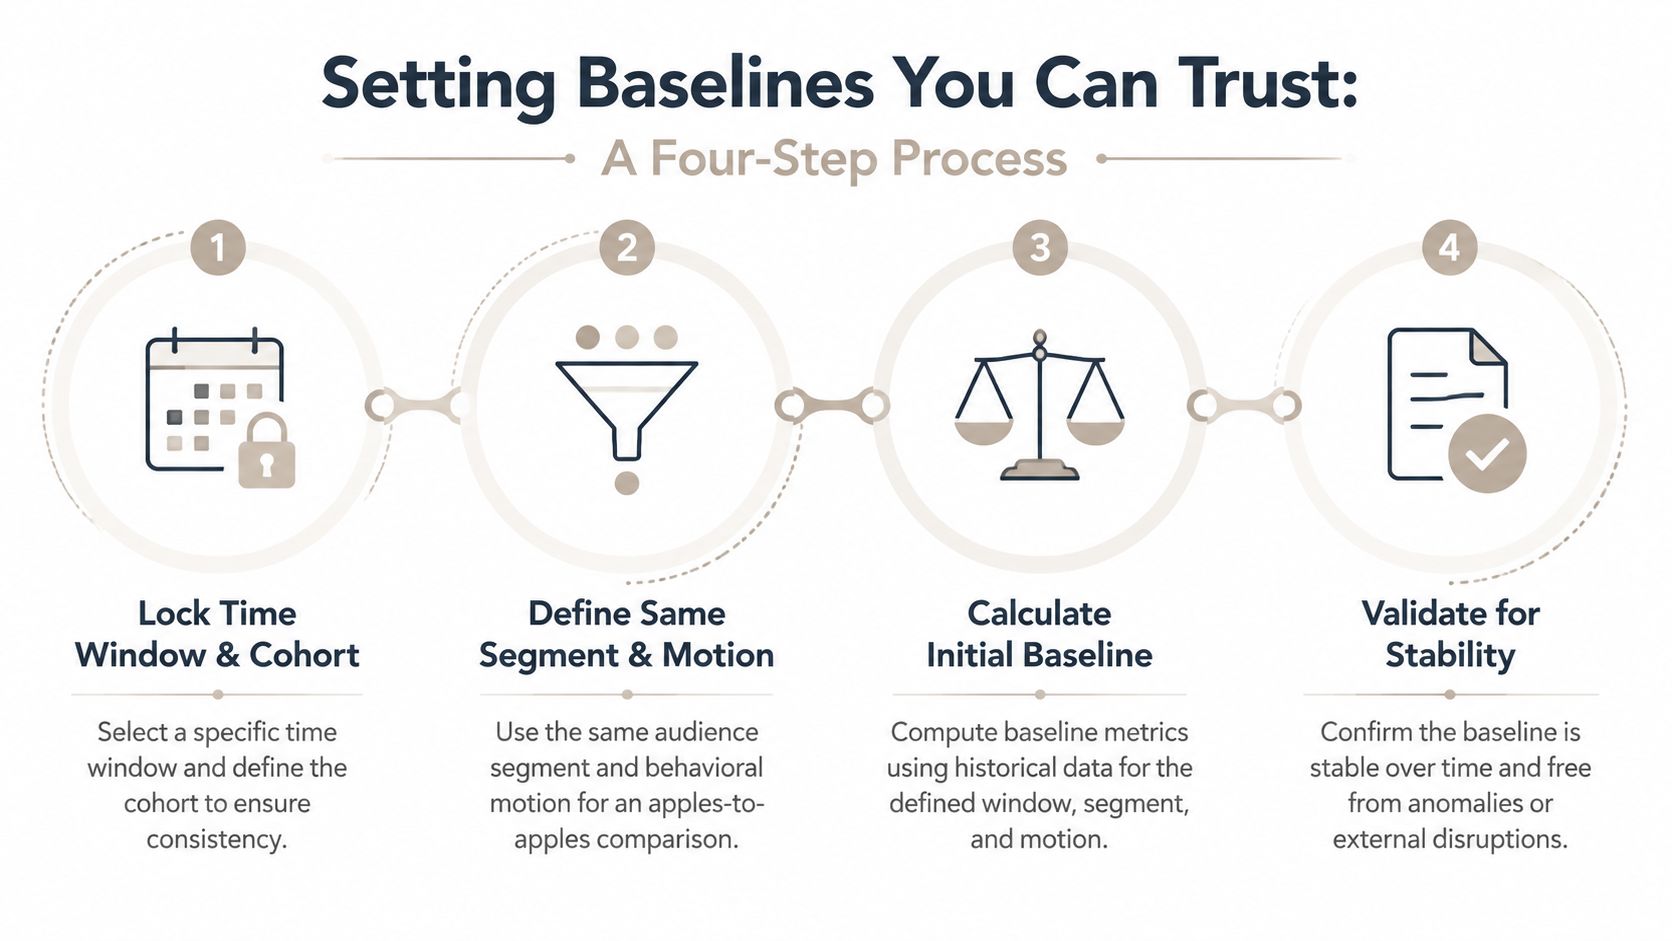
A benchmarking framework from Statistics Canada illustrates the value of explicit comparisons, such as measuring production time against an earlier period or setting a future publication target. Revenue teams need the same discipline. A baseline should make the comparison obvious, reproducible, and difficult to reinterpret after the result is visible. That standard turns benchmarking into a repeatable decision process, not a one-time report.
Collecting and Visualizing Data Without Hiding the Truth
Averages are useful summaries, but they're poor witnesses when performance has a long tail. A mean sales cycle can look healthy while a meaningful group of opportunities remains stuck. A mean page-load time can look acceptable while slow sessions damage customer experience. A mean campaign response can conceal a segment that receives almost no useful engagement.
Percentiles expose that distribution. The 95th percentile is the value 95% of requests finish faster than, leaving the slowest 5% above it. Reporting p50, p90, p95, and p99 together separates typical performance from slow-path behavior and near-worst-case experience.
Collect the shape, not just the headline
Instrument the process at the point where the event occurs. Use CRM event logs for stage movement, telemetry pipelines for application behavior, and defined CRM scrape windows for recurring revenue snapshots. Record the cohort definition, collection window, source system, filters, and outlier treatment alongside the metric.
For critical transactions, the 90th percentile can serve as a diagnostic boundary. A p90 value shows where the slowest 10% begins, which makes it useful for investigation without letting a single extreme outlier dominate the result.
| Statistic | What It Shows | Best Use | Common Trap |
|---|---|---|---|
| Mean | Overall arithmetic average | High-level planning summary | Hides uneven experiences |
| Median, p50 | Typical midpoint | Representing the central user or deal | Can conceal the long tail |
| p90 | Boundary where the slowest 10% begins | Prioritizing critical slow paths | Treated as a complete worst-case view |
| p95 | Boundary where the slowest 5% begins | Service thresholds and customer-facing review | Reported without request volume or errors |
| p99 | Near-worst-case behavior | Stress analysis and reliability review | Overreacting to a small, unstable sample |
Charts should match the question. Use histograms to show distribution shape, box plots to compare cohort variance, control charts to detect drift, and small multiples to compare segments without compressing them into one blended line. A report should also pair response-time data with concurrency and error rate. One published acceptance example combines p95 latency under 1 second, 500 concurrent users, and an error rate below 0.1%, demonstrating how a benchmark becomes a pass/fail rule when speed, load, and reliability appear together in Testerrank's acceptance-criteria guide.
Avoid truncated axes, unlabeled cohort changes, selective date ranges, and dashboards that spotlight the best segment while hiding variance. The load-test reporting reference lists average, total requests, overall error rate, median, minimum, maximum, and percentile values as complementary report fields. Revenue reporting needs the same honesty.
For teams designing executive-ready views, these principles belong alongside data visualization best practices, especially when the audience needs to inspect the evidence rather than accept a polished score.
Turning Results Into Interactive Presentations and Revenue Workflows
A benchmark becomes commercially useful when it changes what a team says, does, or funds. The report shouldn't stop at "segment B is slower." It should show the distribution, identify the likely operating cause, specify the decision, and assign the next action.
Start with the narrative, then connect it to the source. A QBR slide might show a p50 and p90 sales-cycle trend, a segment selector, and an anomaly note for a cohort that moved outside its normal range. The audience can inspect the comparison instead of relying on a screenshot copied into a slide deck weeks earlier.
A benchmark readout deck that survives scrutiny
- Cover: State the revenue question, reporting window, and benchmark owner.
- KPI scorecard: Show the selected metrics, current value, comparison cohort, and status.
- Segment cuts: Let viewers switch between market, motion, region, owner, or campaign source.
- Anomaly callouts: Explain unusual movement with a source-linked note rather than a speculative conclusion.
- Recommended actions: Tie each finding to one operational change.
- Owners and dates: Name the accountable lead and the next review point.
Live data hooks matter because benchmark definitions and source values change. A presentation connected to Google Sheets or a REST API can refresh the evidence while preserving the narrative structure. That's different from exporting a chart as an image and asking the next meeting to trust an artifact that no longer reflects the source.
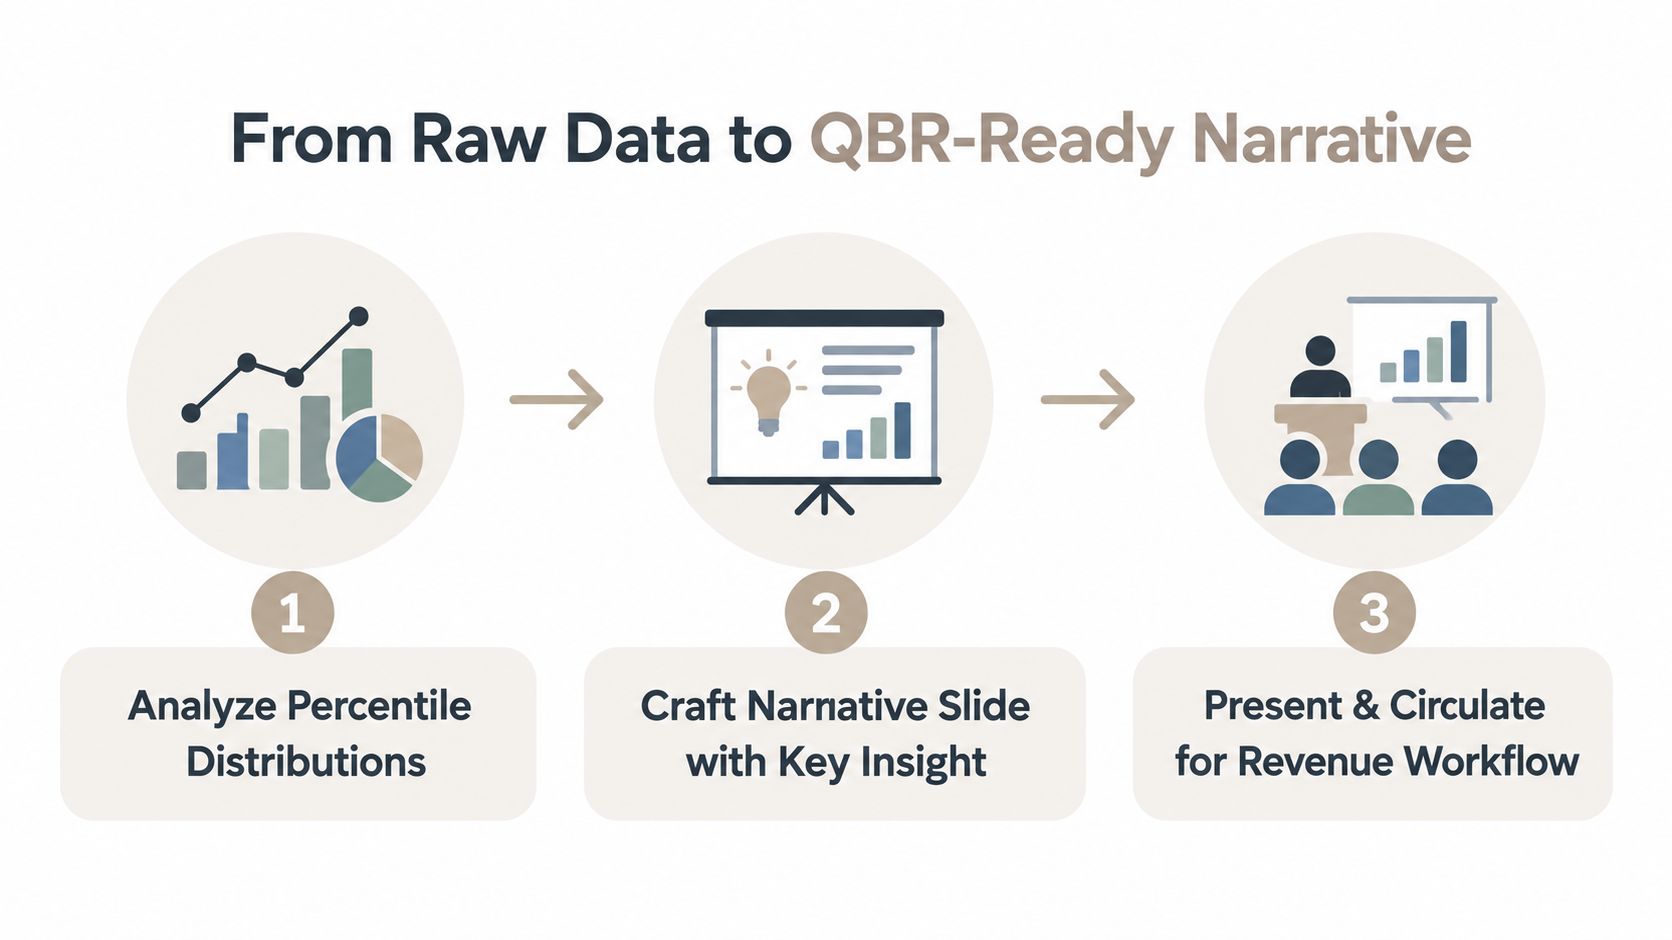
The same benchmark should travel into operating systems. A slowdown in p90 sales cycle can trigger a deal-inspection task, a drop in demo-to-opportunity conversion can update a sales playbook, and a campaign-quality variance can add a qualification note to the next marketing brief. The workflow should make the finding visible where the owner already works.
A static screenshot is dead the moment it's exported. The useful artifact stays connected to its source, its definition, and its next decision.
A real-time data dashboard can support the operating rhythm, provided the dashboard preserves definitions and doesn't reduce a complex distribution to one attractive number. Encelade is one option for turning research, CRM notes, spreadsheets, and documents into interactive, web-native presentations with live data connections, embedded charts, and shareable links. The practical test is simple: can a sales leader open the asset, inspect the comparison, understand the action, and find the current owner without requesting a new slide?
Iterating Without Letting Benchmarks Go Stale
The glossy benchmark report is often the end of the project, and that's why it loses value. A benchmark becomes decorative when nobody owns the definition, no one schedules the rerun, and leaders keep circulating a historical number after the business has changed.
Continuous performance benchmarking requires an operating contract. Name the accountable lead, define the refresh cadence, document the decision trigger, and preserve the source data behind each published result. The AWS guidance on using benchmarking for architectural decisions emphasizes defined objectives, scenarios, metrics, and analysis. Revenue teams need the same structure, even when the benchmark concerns pipeline rather than infrastructure.
A quarterly iteration loop
- Review: Check the current result, source quality, cohort definition, and actions from the previous cycle.
- Re-baseline: Reconfirm that the segment, motion, tools, and qualification rules remain comparable.
- Redesign: Change the test when traffic patterns, product behavior, sales process, or buyer mix has changed.
- Re-measure: Run the revised benchmark, capture distribution and trend data, and inspect stability.
- Redeploy: Refresh the presentation, CRM workflow, playbook, and campaign brief connected to the result.
Rolling windows and control limits help teams detect drift before it becomes a QBR surprise. Version-control the benchmark definition, not just the output. If "qualified opportunity" changes, record that change beside the historical series so a later reader knows whether a movement reflects performance or taxonomy.
A disciplined benchmark also needs an action register. Each finding should have a named owner, a due date, a threshold that triggers escalation, and a place where completion is recorded. Research on benchmarking implementation identifies weak management commitment, unclear working groups, poor peer selection, and confusion between measuring "how much" and learning "how to" as recurring obstacles. The study reports that around 55% of organisations provide no benchmarking training or do so rarely, and about 36% implement findings from less than 40% of benchmarking projects, according to the Massey University research.
Decorative benchmarking erodes credibility. Once sales and marketing leaders learn that published figures aren't refreshed or connected to action, they stop using the benchmark to influence pipeline investment.
Your One-Page Benchmark Action Checklist
Put this checklist in the project ticket, shared workspace, or operating review. Each item should produce an artifact another person can inspect without reconstructing the process from memory.
- Write the revenue question: Create a one-sentence decision brief that states what the team needs to decide.
- Select two to three KPIs: Record the chosen pipeline, conversion, cycle, or retention measures and their owners.
- Capture a 30-day baseline: Save the source extract, cohort definition, filters, and environment-parity notes.
- Set the stability guardrail: Document the planned sample size and the coefficient-of-variation rule that will pause the conclusion.
- Centralize the data: Place the raw values and metadata in a shared sheet or controlled data store.
- Build two views: Create one percentile chart for distribution and one trend chart for movement over time.
- Annotate the readout: Add the source, refresh window, benchmark definition, and accountable owner to the presentation slide.
- Schedule a 14-day review: Create the calendar event with the decision trigger and action register attached.
- Archive the version: Store the results, definitions, source extracts, and final deck in a versioned template.
This sequence keeps the work auditable after a handoff. It also heads off the familiar failure where a team ends up arguing about the number because nobody preserved how it was calculated.
Start with one revenue question this week. Keep the first benchmark narrow, make the comparison defensible, and refuse to publish a result that has no owner or follow-up action.
Encelade helps revenue teams turn benchmark data from spreadsheets, CRM notes, and source documents into interactive, shareable presentations with live data connections and on-brand visual components. To build a decision-ready benchmark readout that stays aligned with changing source data, book a 30-minute demo.